 This research was carried out by LDA Design, with City Science and Vectos. It explores how different places can achieve an 80% reduction in surface transport emissions by 2030, as part of a pathway to net zero by 2050.
It combines advanced carbon modelling with stakeholder workshops in order to test the impact of forty carbon reduction interventions in four place typologies: a unicentric city, a polycentric conurbation, a regeneration town and a growing county. By setting out an emissions reduction pathway and spatial vision for each typology, it demonstrates the contribution of spatial planning and place-based solutions to transport decarbonisation.
You can download a PDF version of the report (recommended) or read it below.
The report is accompanied by a discussion paper on ways to overcome the barriers to net zero transport, and a methodological appendix which explains the approach to carbon modelling.
Report authors: Spencer Powell (LDA Design), Laurence Oakes-Ash (City Science), Paul Curtis (Vectos) and James Harris (Royal Town Planning Institute)
Report contributors: Catherine Ham and Frazer Osment (LDA Design), Simon Lusby, Alex Dawn and Dr Stephen Welbourne (City Science), Jonathan Lloyd (Vectos)
Acknowledgements: This project was part-sponsored by the RTPI North East region, and supported by the Transport Planning Society (TPS) and Chartered Institution of Highways and Transportation (CIHT). The team would like to thank the 40 stakeholders who generously contributed their time and expertise to the eight workshops held during the course of this research. Their names are listed in the PDF report.
The research also benefitted from the oversight of an expert steering group, composed of Lynn Basford MRTPI FCIHT (Basford Powers Ltd and Chartered Town Planner, representing CIHT), Richard Walker (Transport Planning & Strategy Adviser at the Department for Transport, currently on secondment to Leeds University) and Kate Morris (a Chartered Transport Planning Professional and Chartered Engineer, representing the Transport Planning Society).
Contents
1.1. Spatial planning and net zero surface transport
1.2. Understanding net zero: the Paris Agreement and UK Climate Change Act
1.3. Approaches to carbon budgeting and emission reduction targets
2.1. Identifying potential interventions to reduce surface transport emissions
2.2. Creating place typologies
2.4. Using the Sustainable Accessibility and Mobility (SAM) Framework
2.5. Testing carbon reduction interventions
3.1. We need to plan for a ‘do everything’ carbon scenario
3.2. A pathway to net zero emissions
3.3. The four pathway steps, explained
4. Planning for net zero transport
4.1. A new model of spatial planning
4.2. Core spatial planning principles
4.3. Critical building blocks for a low-carbon built environment
4.5. Spatial visions for the four typologies
5. Delivering net zero transport
5.1. Recommendations from the stakeholder workshops
Executive summary
The UK needs to rapidly reduce greenhouse gas emissions from surface transport, where very little progress has been made over the last 30 years.
This research explores how different places could achieve an 80% reduction in surface transport emissions by 2030, on a pathway to net zero by 2050. It combines advanced carbon modelling with stakeholder engagement and desk-based research in order to identify and test the impact of approximately 40 carbon reduction interventions in four ‘place typologies’. These are typical of real places in England, and include a unicentric city, a polycentric conurbation, a regeneration town and a growing county.
For each typology, our research demonstrates the need for a comprehensive package of interventions to reduce transport emissions. Our modelling takes a place-based approach which prioritises measures which reduce the overall need to travel, followed by those which shift trips to active, public and shared transport, and finally those which switch vehicles to cleaner fuels. By following this hierarchy, decarbonisation acts as a catalyst for reducing car dependency and creating healthier, safer and more equitable communities. By contrast, the switch to cleaner fuels only accounts for just over half of the necessary emission reductions, reinforcing the need for a ‘do everything’ approach.
In our modelling, a ‘do nothing’ scenario sees transport emissions increase. To avoid this, all new development should be located and designed to generate zero emissions from surface transport, and should enable carbon reduction in other places to achieve ‘carbon negative growth’.
The planning system should also prioritise urban renewal that enables growth while achieving a substantial reduction in travel demand. This should focus on maximising the potential for local living by ensuring that most people can access a wide range of services, facilities and public spaces by walking and cycling. Increased home working, digital service delivery, and new forms of flexible work and community spaces will play a key role, alongside investment in place.
Residual travel demand should be shifted away from private vehicles to active, public and shared forms of transport, at a scale which significantly exceeds current UK best practice. Integrated transport networks should be accompanied by access and parking restrictions for private vehicles, creating liveable streets and ensuring that sustainable modes are always the most convenient and affordable choice.
Achieving this requires a decisive break with the conventional approach of meeting predicted changes in travel demand with new road capacity. The planning system must also look beyond the promotion, allocation and servicing of land for new development. The scale of this challenge requires a truly integrated approach that unites transport and land use planning to deliver place-based visions which meet ambitious targets for trip reduction, modal shift and carbon reduction, alongside other economic, social and environmental objectives.
To help envisage this transformation, our research created a spatial vision for each of the place typologies in 2030 which maps out key carbon reduction interventions. This shows what an ambitious emission reduction pathway might look like for different types of place, and the wider benefits that can be unlocked.
Achieving these place-based visions requires a policy framework that puts the reduction of carbon at the heart of decision making, and enables the planning, funding and delivery of the necessary interventions to create genuinely sustainable communities. This report is accompanied by a discussion paper which sets out potential barriers to achieving these objectives, and suggests recommendations for change.
1. Introduction
1.1. Spatial planning and net zero surface transport
Transport is the largest contributor to the UK’s greenhouse gas (GHG) emissions. While emissions from other sectors have fallen dramatically since 1990, those from transport have reduced by under 3%[1]. In an average local authority, transport is responsible for 35.5% of all emissions, with the sector remaining 98% reliant on fossil fuels[2].
The government has recognised that transport plays a critical role in achieving net zero, saying that “...the scale of the challenge demands a step change in both the breadth and scale of ambition and we have a duty to act quickly and decisively to reduce emissions”[3].
Despite this ambition, and the rhetoric around “building back better” from the Covid-19 pandemic, the UK is set to spend £30bn on new roads during the current Parliament, with only £2bn for active travel infrastructure[4]. There are significant gaps in national policy, with the latest report to Parliament from the Committee on Climate Change (CCC) noting that 2020 was “...not the year of policy progress that the Committee called for in 2019”[5].
Despite many local authorities setting ambitious targets to achieve net zero by 2030, well in advance of the UK’s statutory 2050 target, monitoring of local emissions is patchy and the delivery of solutions on the ground remains slow[6]. Recent criticism over the car-dependency of the new generation of Garden Towns also highlights a major disconnect between net zero ambitions and the reality of much planning and placemaking today[7].
Put simply, the planning system often appears to deliver the wrong type of development in the wrong place, and does not fully consider the impact of development on carbon emissions. At the same time, spatial planning is tasked with responding to other priorities, such as housing delivery, nature recovery, flood risk, air pollution, and mental and physical health. They also include the challenges faced by towns and cities that, even before the Covid-19 pandemic, were struggling to adapt to structural shifts in the economy, consumer habits and lifestyle choices[8].
This research starts from the premise that there is a clear relationship between spatial planning and carbon, and that only a place-based approach can deliver net zero transport emissions and be a catalyst for better placemaking to deliver healthier, happier, more resilient communities.
1.2. Understanding net zero: the Paris Agreement and UK Climate Change Act
The Paris Agreement signed at the United Nations Climate Conference in 2015 (COP21) was the first comprehensive legally binding global climate change agreement. It set out a framework to avoid the dangerous impacts of climate change by limiting global temperature rise to “well below 2 degrees Celsius” above pre-industrial levels, and committed signatories to pursue efforts to limit the temperature increases to 1.5 degrees Celsius[9].
In June 2019, the UK parliament passed legislation which replaced a previous target of an 80% reduction in GHG emissions by 2050 with a more ambitious target to reduce the UK’s net emissions to zero by 2050 – the so-called “Net Zero” target[10]. The UK was the first country in the world to set this target in law. All the major political parties pledged to abide by this target in their manifestos for the December 2019 General Election, which points to a clear consensus on the need for action.
Zero emissions would mean no production of any emissions from any sector. However, there are some sectors, such as farming and aviation, where this is not anticipated to be possible[11]. A net zero target recognises that some emissions will be difficult to fully remove, but that these can be fully offset so that the UK’s balance of emissions is zero. In May 2019, the CCC concluded that “net-zero is necessary, feasible and cost-effective”[12].
1.3. Approaches to carbon budgeting and emission reduction targets
A carbon budget sets a cap on total greenhouse gas emissions, which should not be exceeded in order to meet emission reduction commitments. In the UK, statutory carbon budgets are set for five year periods by Parliament on the advice of the CCC, and look twelve years into the future.
Carbon budget-setting is not without debate. The question of an appropriate carbon budget for the UK depends on accounting assumptions, modelling assumptions, the ethical position taken in relation to the UK’s responsibility for historic carbon, and its role in supporting other countries to decarbonise[13]. For example, estimates of UK GHG emissions in 2016 ranged from a minimum of 473 million tonnes of carbon dioxide equivalent on a Climate Change Act basis, to a maximum of 784 million tonnes of carbon dioxide equivalent on a footprint basis[14]. The UK’s carbon budgets currently exclude emissions from international aviation and shipping, which are only expected to be included after 2023.
As a result of differences in what emissions are included, some countries and regions have adopted earlier dates for net zero emissions. This includes over 50 local authorities in the UK that have set earlier targets for county, borough or city-wide activities and infrastructure[15].
Globally, what matters most from the perspective of climate change is the scientific estimate of the carbon budget, which can differ from nationally adopted budgets. The most recent estimate from the Intergovernmental Panel on Climate Change (IPCC) is that a global carbon budget of 420 gigatonnes would provide a 66% chance of remaining within 1.5°C of warming[16]. Pure “science-based” targets start with this global carbon budget and allocate it down to national or sub-national levels.
Such targets have been developed by researchers from the University of Manchester and the Tyndall Centre for Climate Change Research[17]. These ‘science-based’ targets are available to UK local authorities through an online tool[18]. This allows users to calculate a carbon budget for any UK local authority or larger administrative area, and create climate change targets that are based on the commitments from COP21 and the latest synthesis report from the IPCC.
The targets proposed by the Tyndall Centre equate to an average 12-14% annual reduction in emissions for the majority of places in the UK, in order to achieve a local carbon budget aligned to the Paris Agreement commitments.
Given the limited progress the transport sector has made to date on decarbonisation, these levels of change are unprecedented and equate to an 80% reduction in carbon emissions from surface transport by 2030. This is an incredibly challenging target that – based on past performance – the UK is unlikely to meet. However, if we are to rise to the challenge, achieve net zero and avoid climate catastrophe, actions need to be ambitious and have real impact.
In that context, this research uses the more ambitious science-based target of an 80% reduction in emissions from surface transport by 2030 as the basis for modelling and analysis.
In order to meet the UK’s overall net zero emissions target, the remaining 20% of emissions from surface transport would need to be eliminated by 2050. This points to the need to plan for a fully zero carbon surface transport network without offsetting, which should only be used alongside emissions reductions to achieve net zero in aviation and shipping.
2. Methodology
This research coupled qualitative methods (including online stakeholder workshops) with quantitative data analysis and modelling to enable the potential carbon impact of different interventions to be considered. This chapter summarises the process.
2.1. Identifying potential interventions to reduce surface transport emissions
The research team started by compiling a list of potential interventions that would be expected to reduce emissions from surface transport and contribute to delivery of better placemaking outcomes. This included transport planning interventions, such as measures to facilitate greater uptake of walking, cycling and public transport provision, and spatial planning measures to reduce travel demand and encourage behaviour change. The interventions were based on a literature review, and on the knowledge of existing best practice from professionals on the project team.
Additional interventions were suggested by stakeholders at a later stage, resulting in approximately 40 interventions being considered as part of the research. The full list of interventions is presented in Table 2.1.
2.2. Creating place typologies
Four representative ‘place typologies’ were then created in order to make the theoretical aspects of the research real and relevant, and to provide a focus for discussion with stakeholders.
The typologies are intended to represent a diverse mix of towns, cities and regions that share common characteristics and spatial challenges. Baseline data for each typology was drawn from detailed transport models, disaggregated carbon data and qualitative observations from real places that corresponded with the characteristics of that typology.
The typologies are not exact depictions or representations of any single place. This approach ensures that the analysis is robust, and the findings are relevant and transferable to a broad range of places. The four place typologies, from largest to smallest, are:
- Wotton City-Region: a polycentric conurbation
- Castlemore: a regional unicentric city
- Stoneborough: a regeneration town
- Ebsham: a village in the county of Monteshire
The following section contains an introduction to each of the typologies.
Welcome to the Wotton City-Region: a polycentric conurbation
Figure 2.1. The Wotton City-Region (click to expand)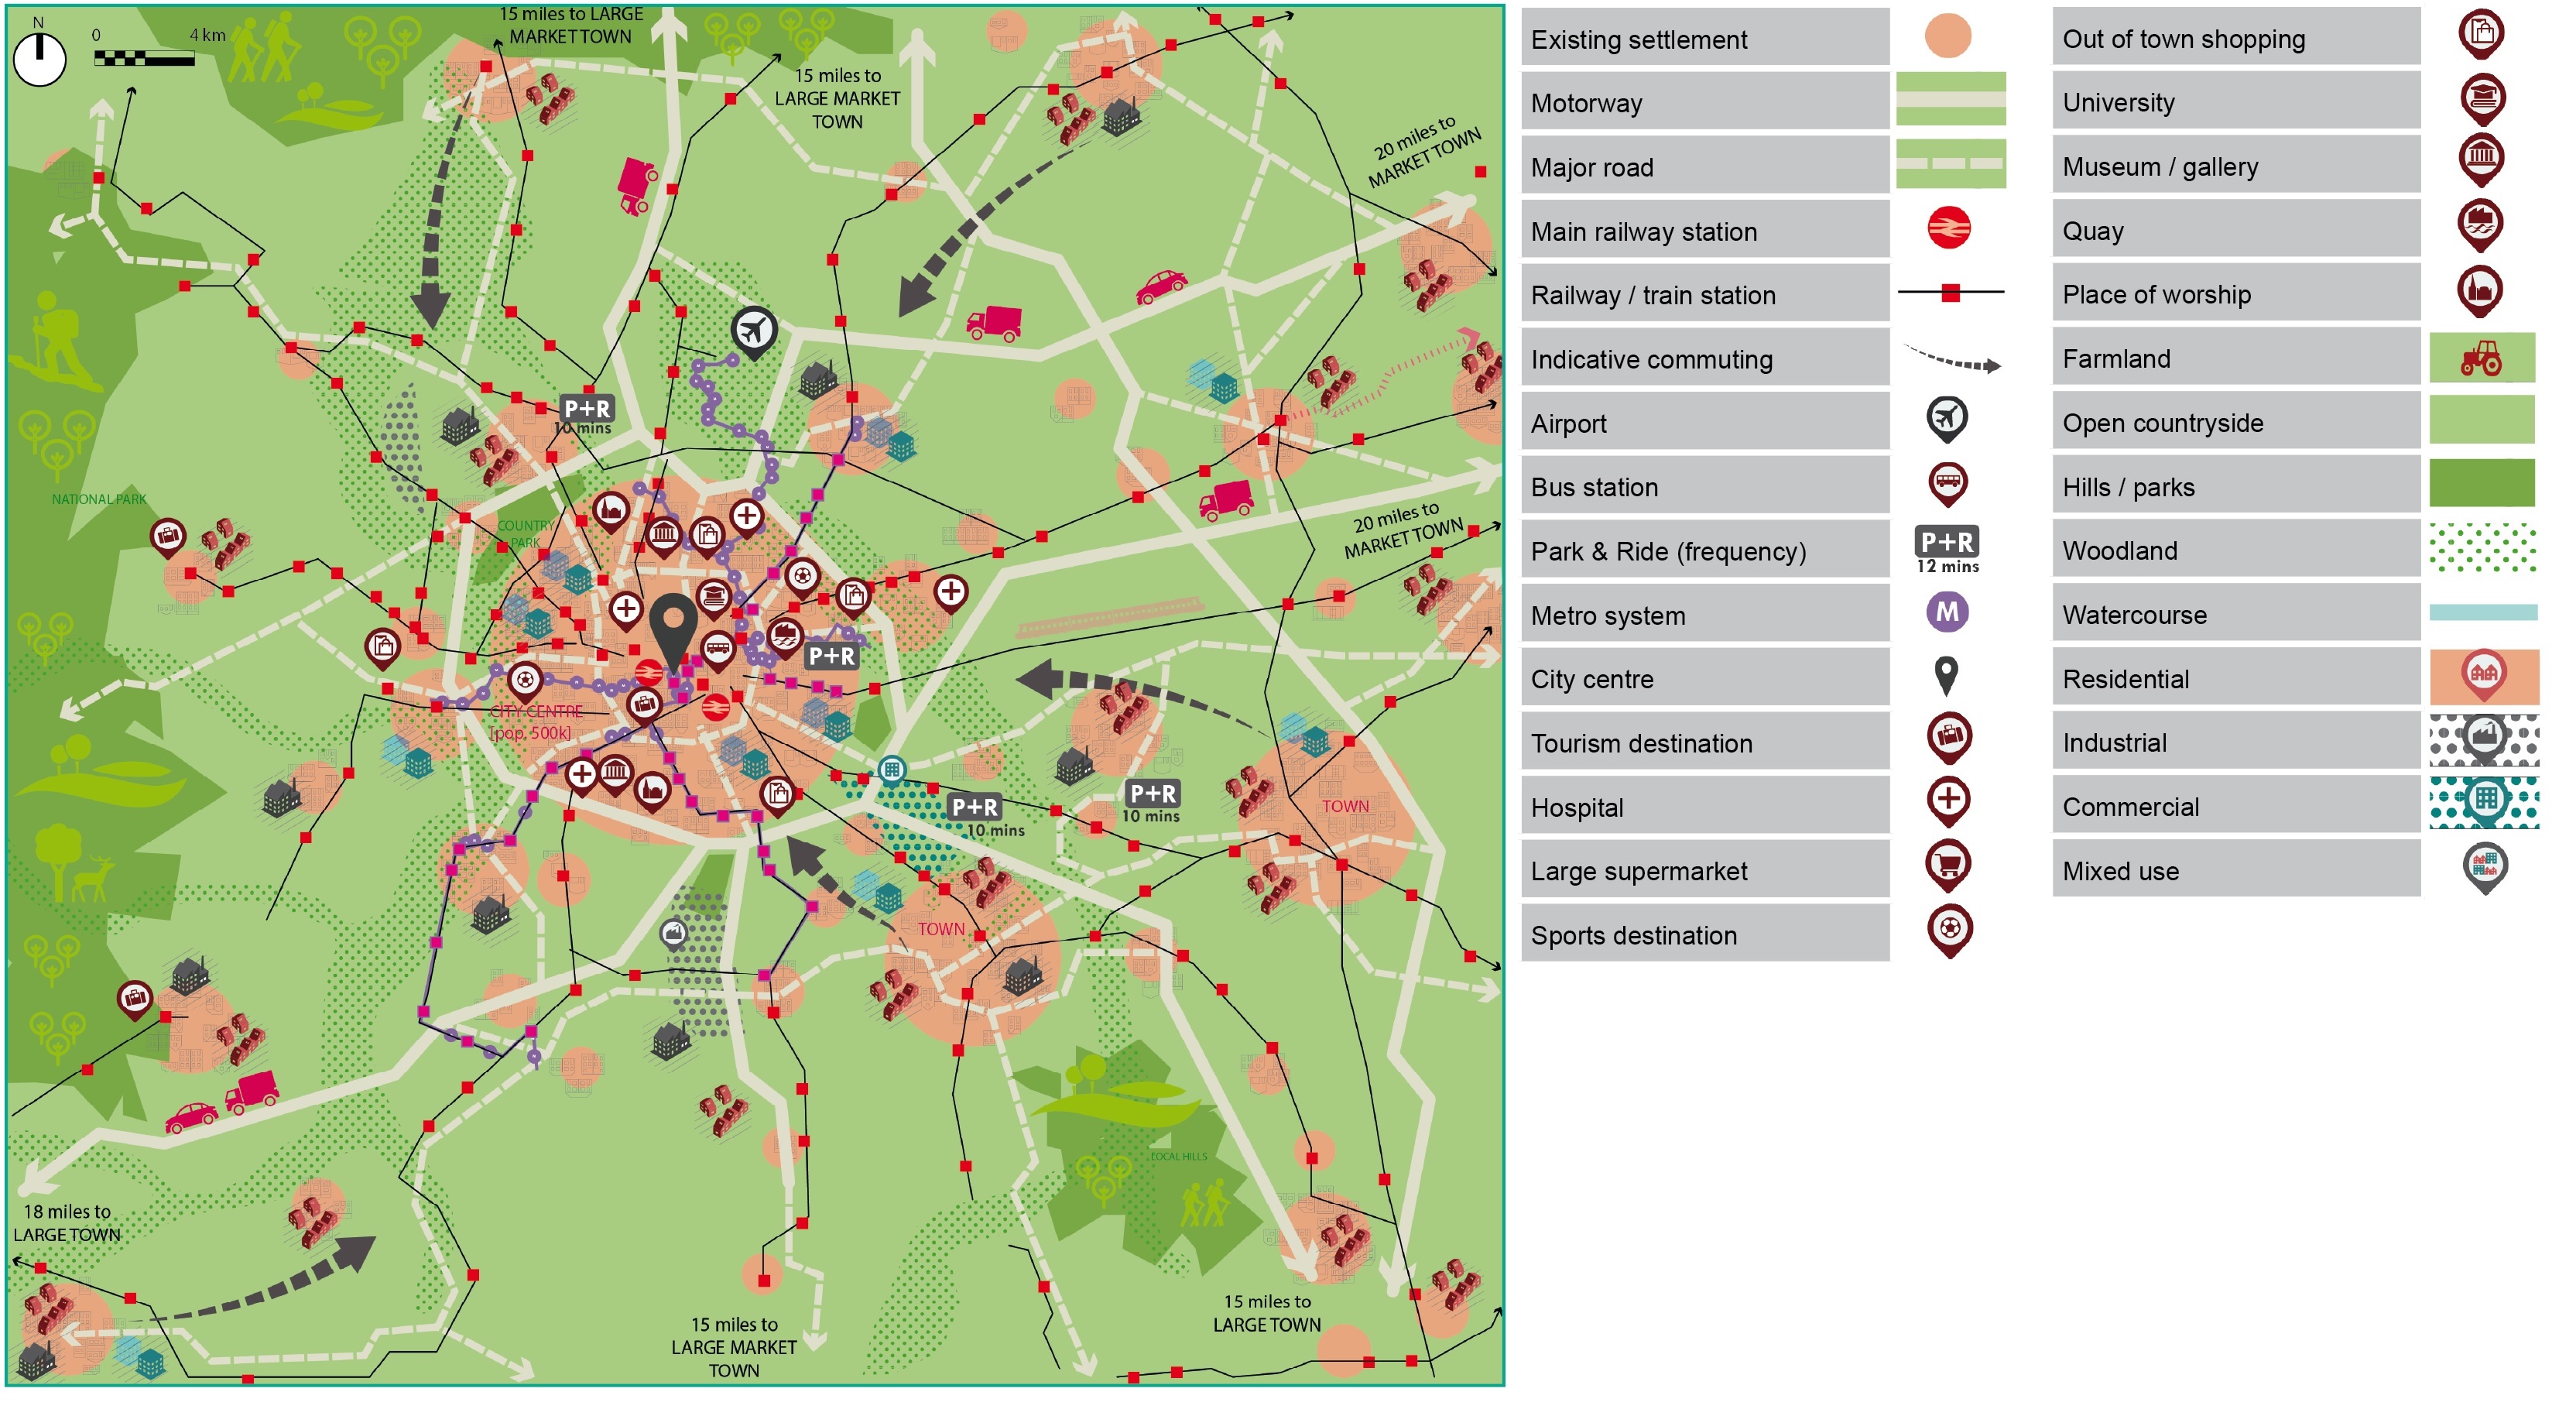
Population and housing: A large, nationally important conurbation of approximately 3 million people, with high housing need. Recent and planned growth is focused on brownfield regeneration, densification and the release of Green Belt land.
Economy and employment: The principal city is an economically dynamic hub for education, commerce, leisure and tourism, but surrounding towns have struggled to diversify their economies following the decline of traditional manufacturing industries. There are significant area-based disparities in income, skills, deprivation and environmental quality, with many town centres suffering long term decline. Complex land remediation requirements and viability are a barrier to brownfield development.
Travel and transport: There is significant out-commuting from peripheral towns to the principal city and to employment sites on infrastructure corridors. The public transport network comprised of bus, heavy rail and light rail systems, with plans to create a new walking and cycling network and increase uptake of electric vehicles. Integration of ticketing and networks is limited, and funding is not in place to deliver planned improvements.
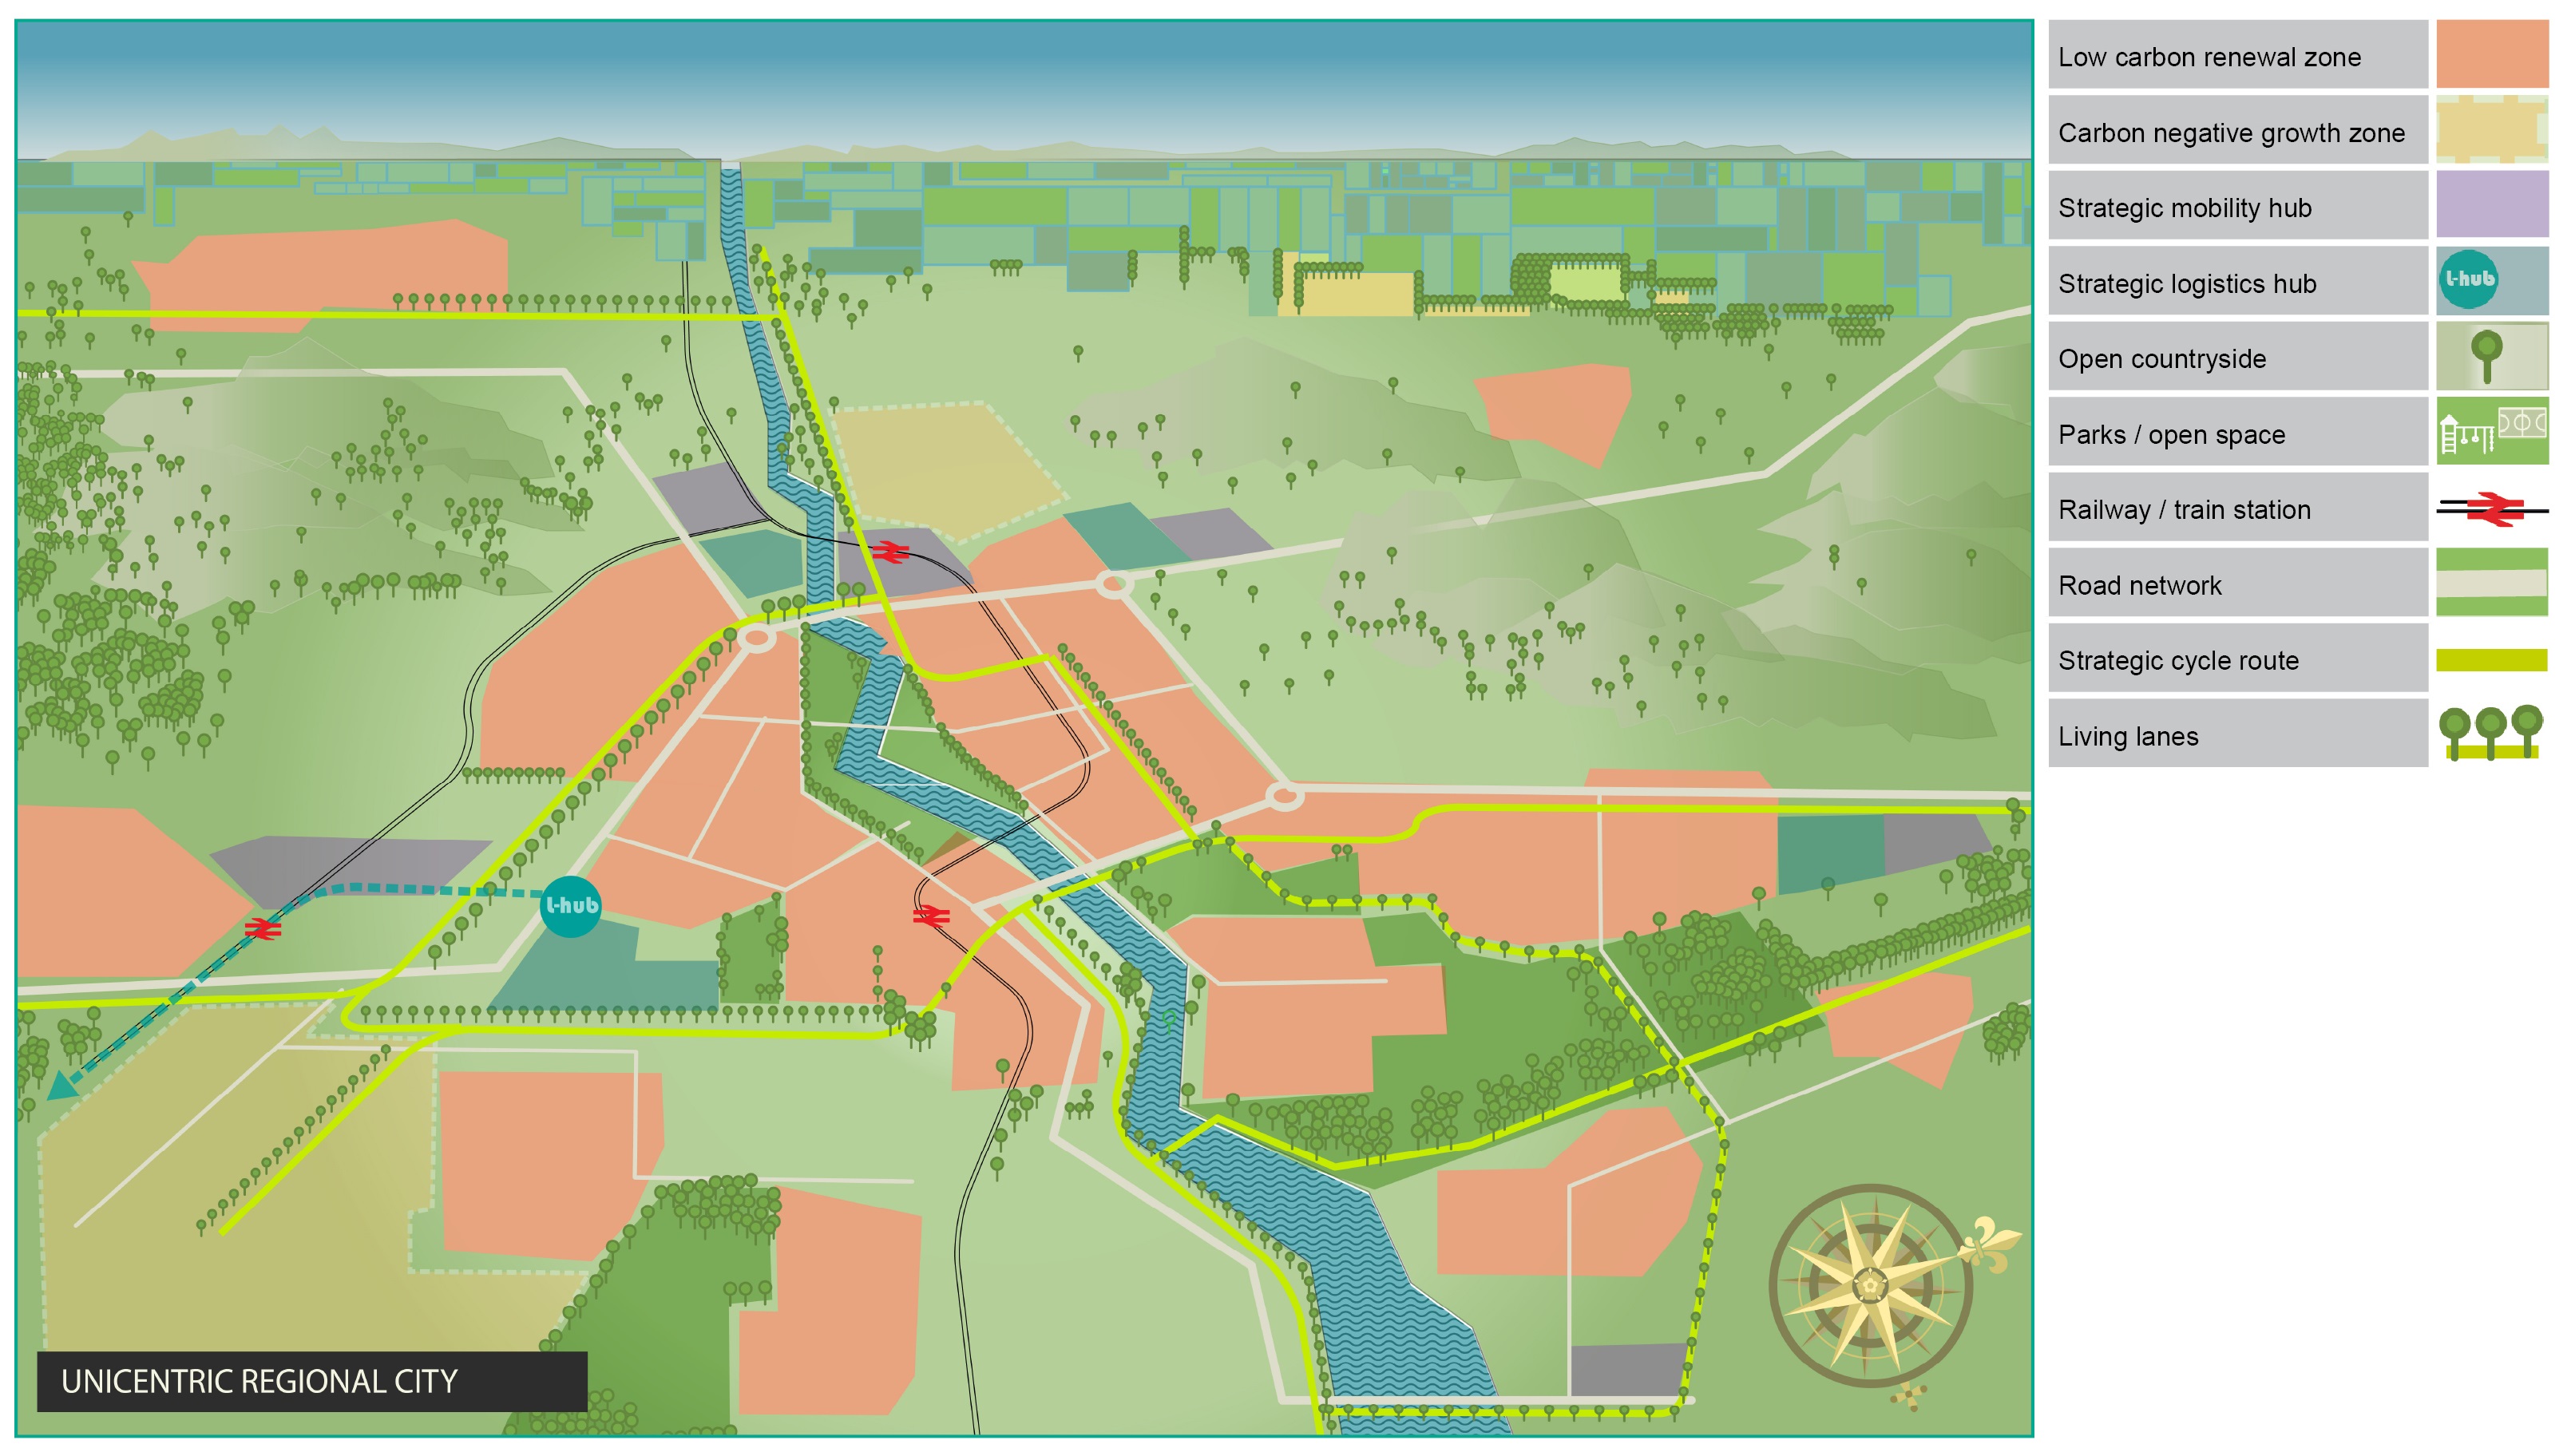
Welcome to Castlemore: a regional unicentric city
Figure 2.2. The city of Castlemore and surrounding area (click to expand)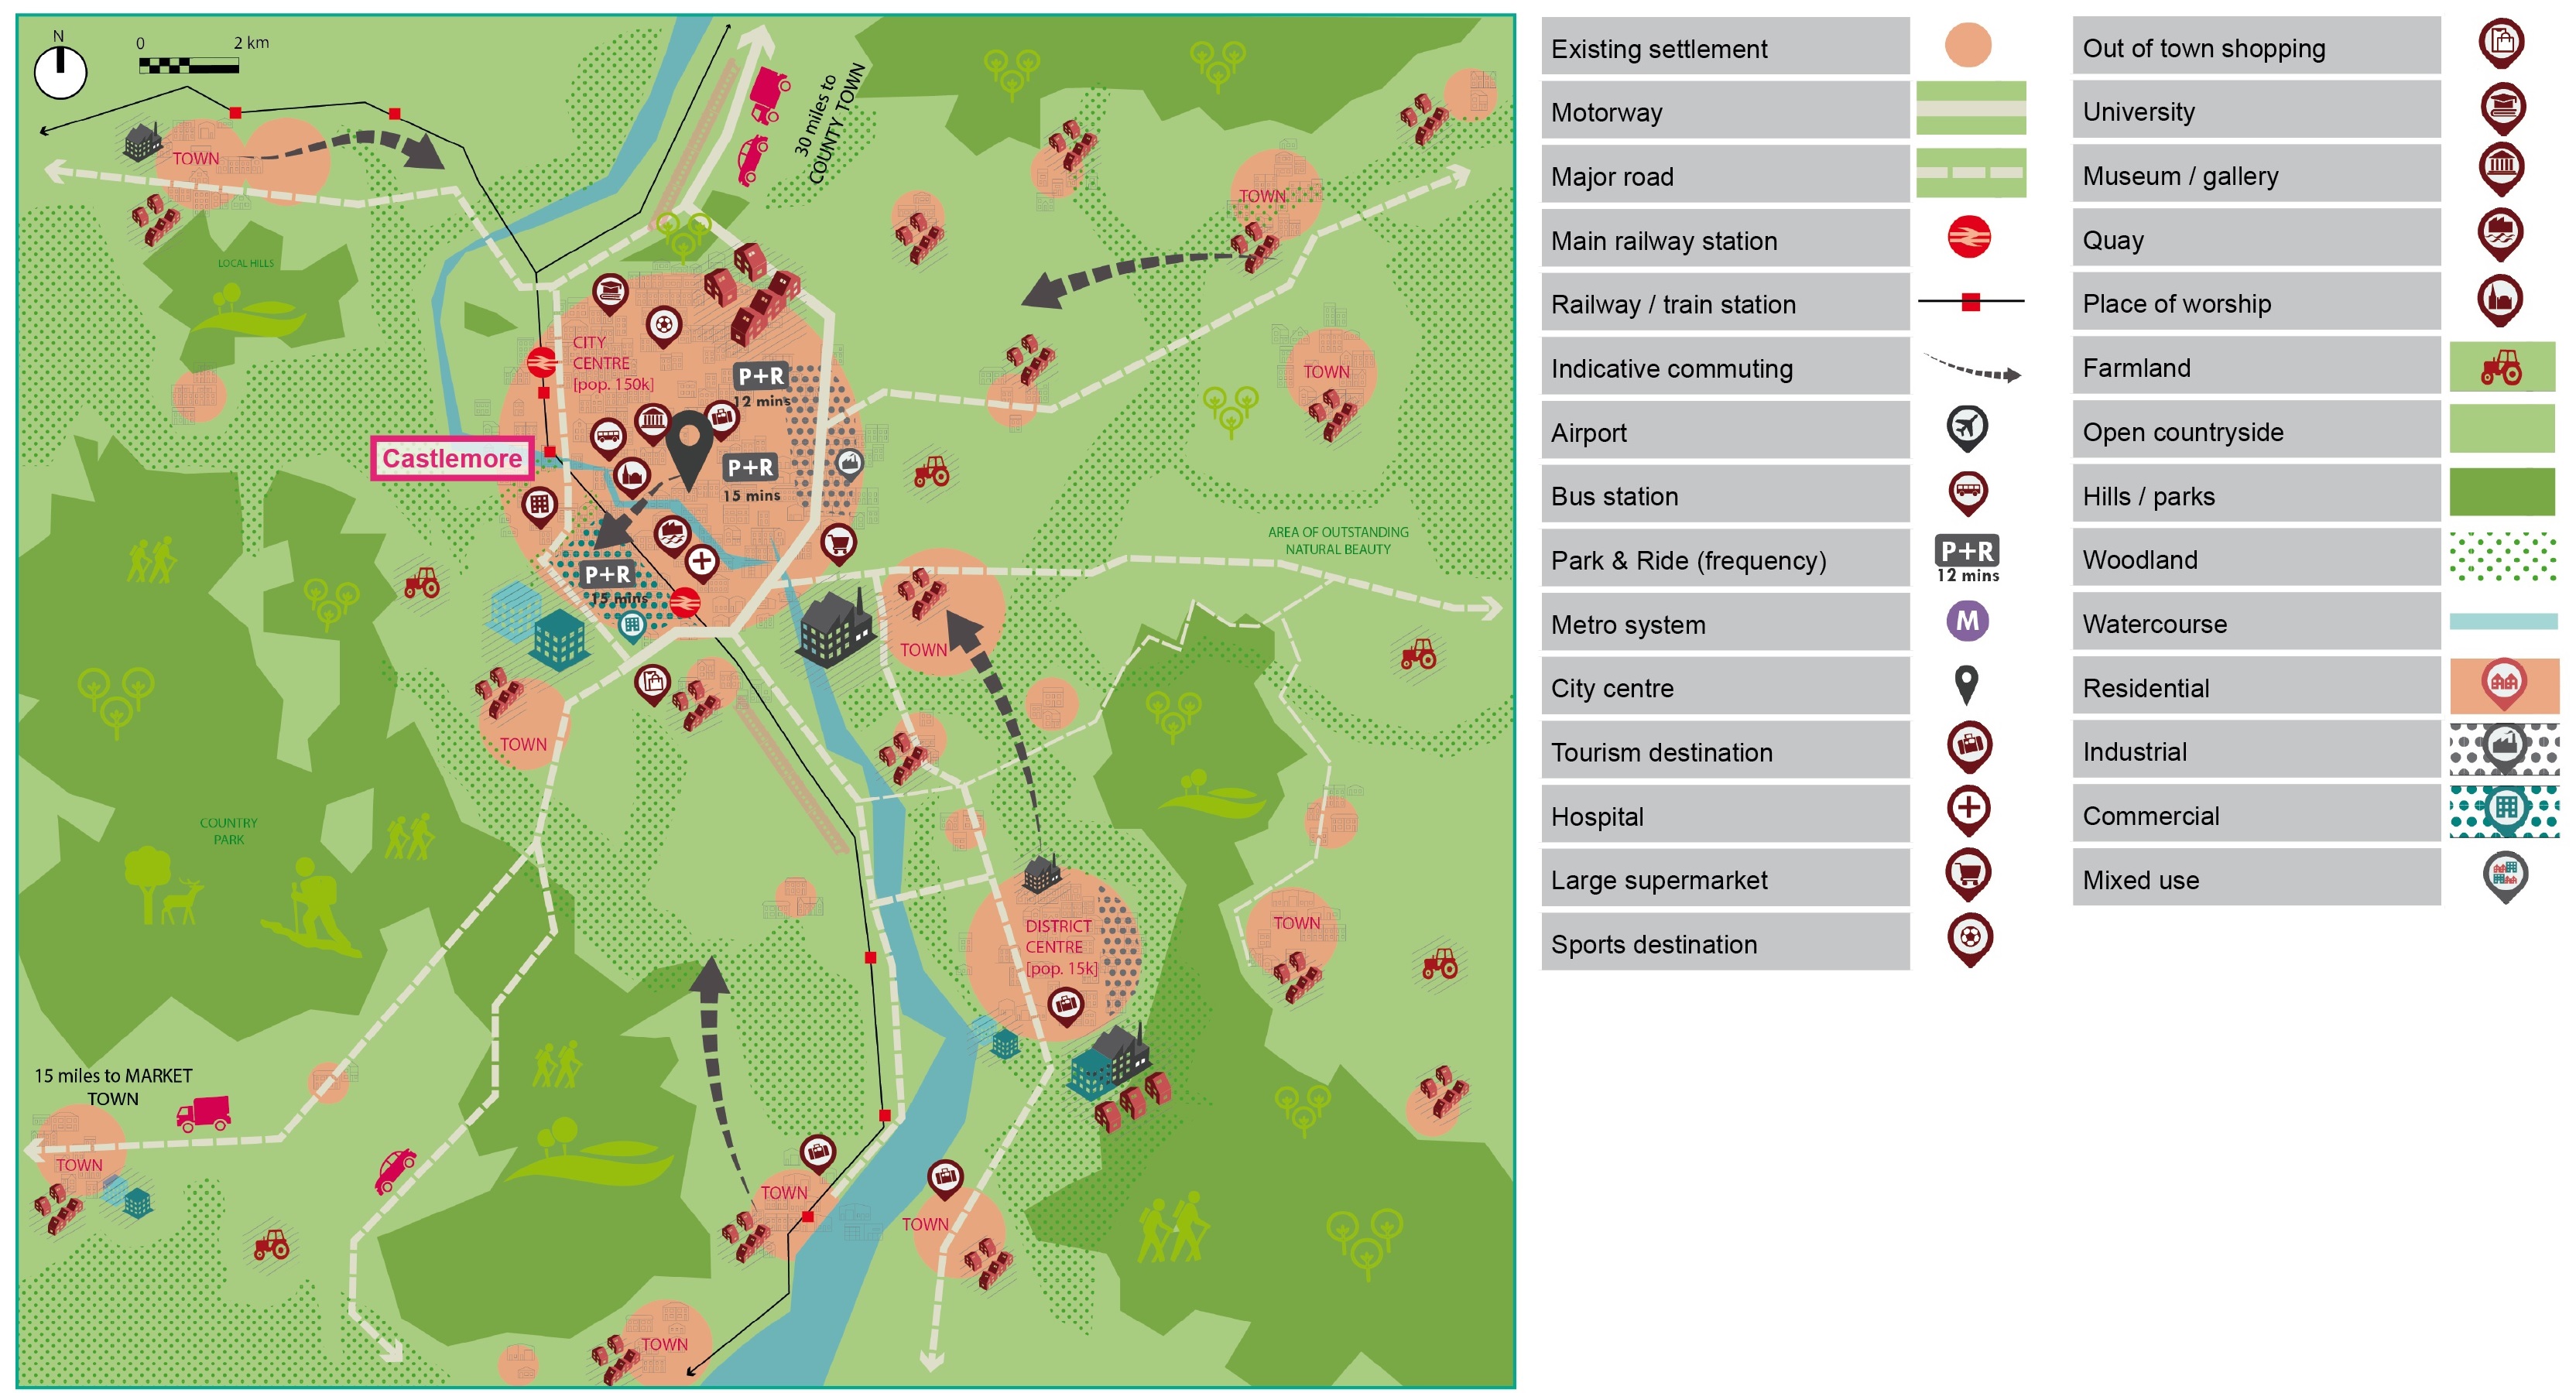
Population and housing: A prosperous and growing city of approximately 150,000 people, set within a largely rural area. It has high housing need and takes the traditional approach of lower-density urban extensions which often fail to meet targets or deliver quality outcomes.
Economy and employment: The majority of jobs are in health, education, retail and public and professional services, with a strong rural agricultural sector and new sectors emerging in biological and environmental science. There is a diversified city centre economy, but this is increasingly reliant on leisure and residential uses as retail declines and employment shifts to peripheral business parks.
Travel and transport: There is significant in-commuting from the surrounding hinterland, and movement within the city to peripheral employment sites. Public transport is comprised of heavy rail and buses, with a limited bike hire network and poor integration between public transport and active travel networks. The city is strongly influenced by its rural hinterland, with green corridors and public rights of way providing links for commuting and leisure.
Welcome to Stoneborough: a regeneration town
Figure 2.3. The town of Stoneborough and surrounding area (click to expand)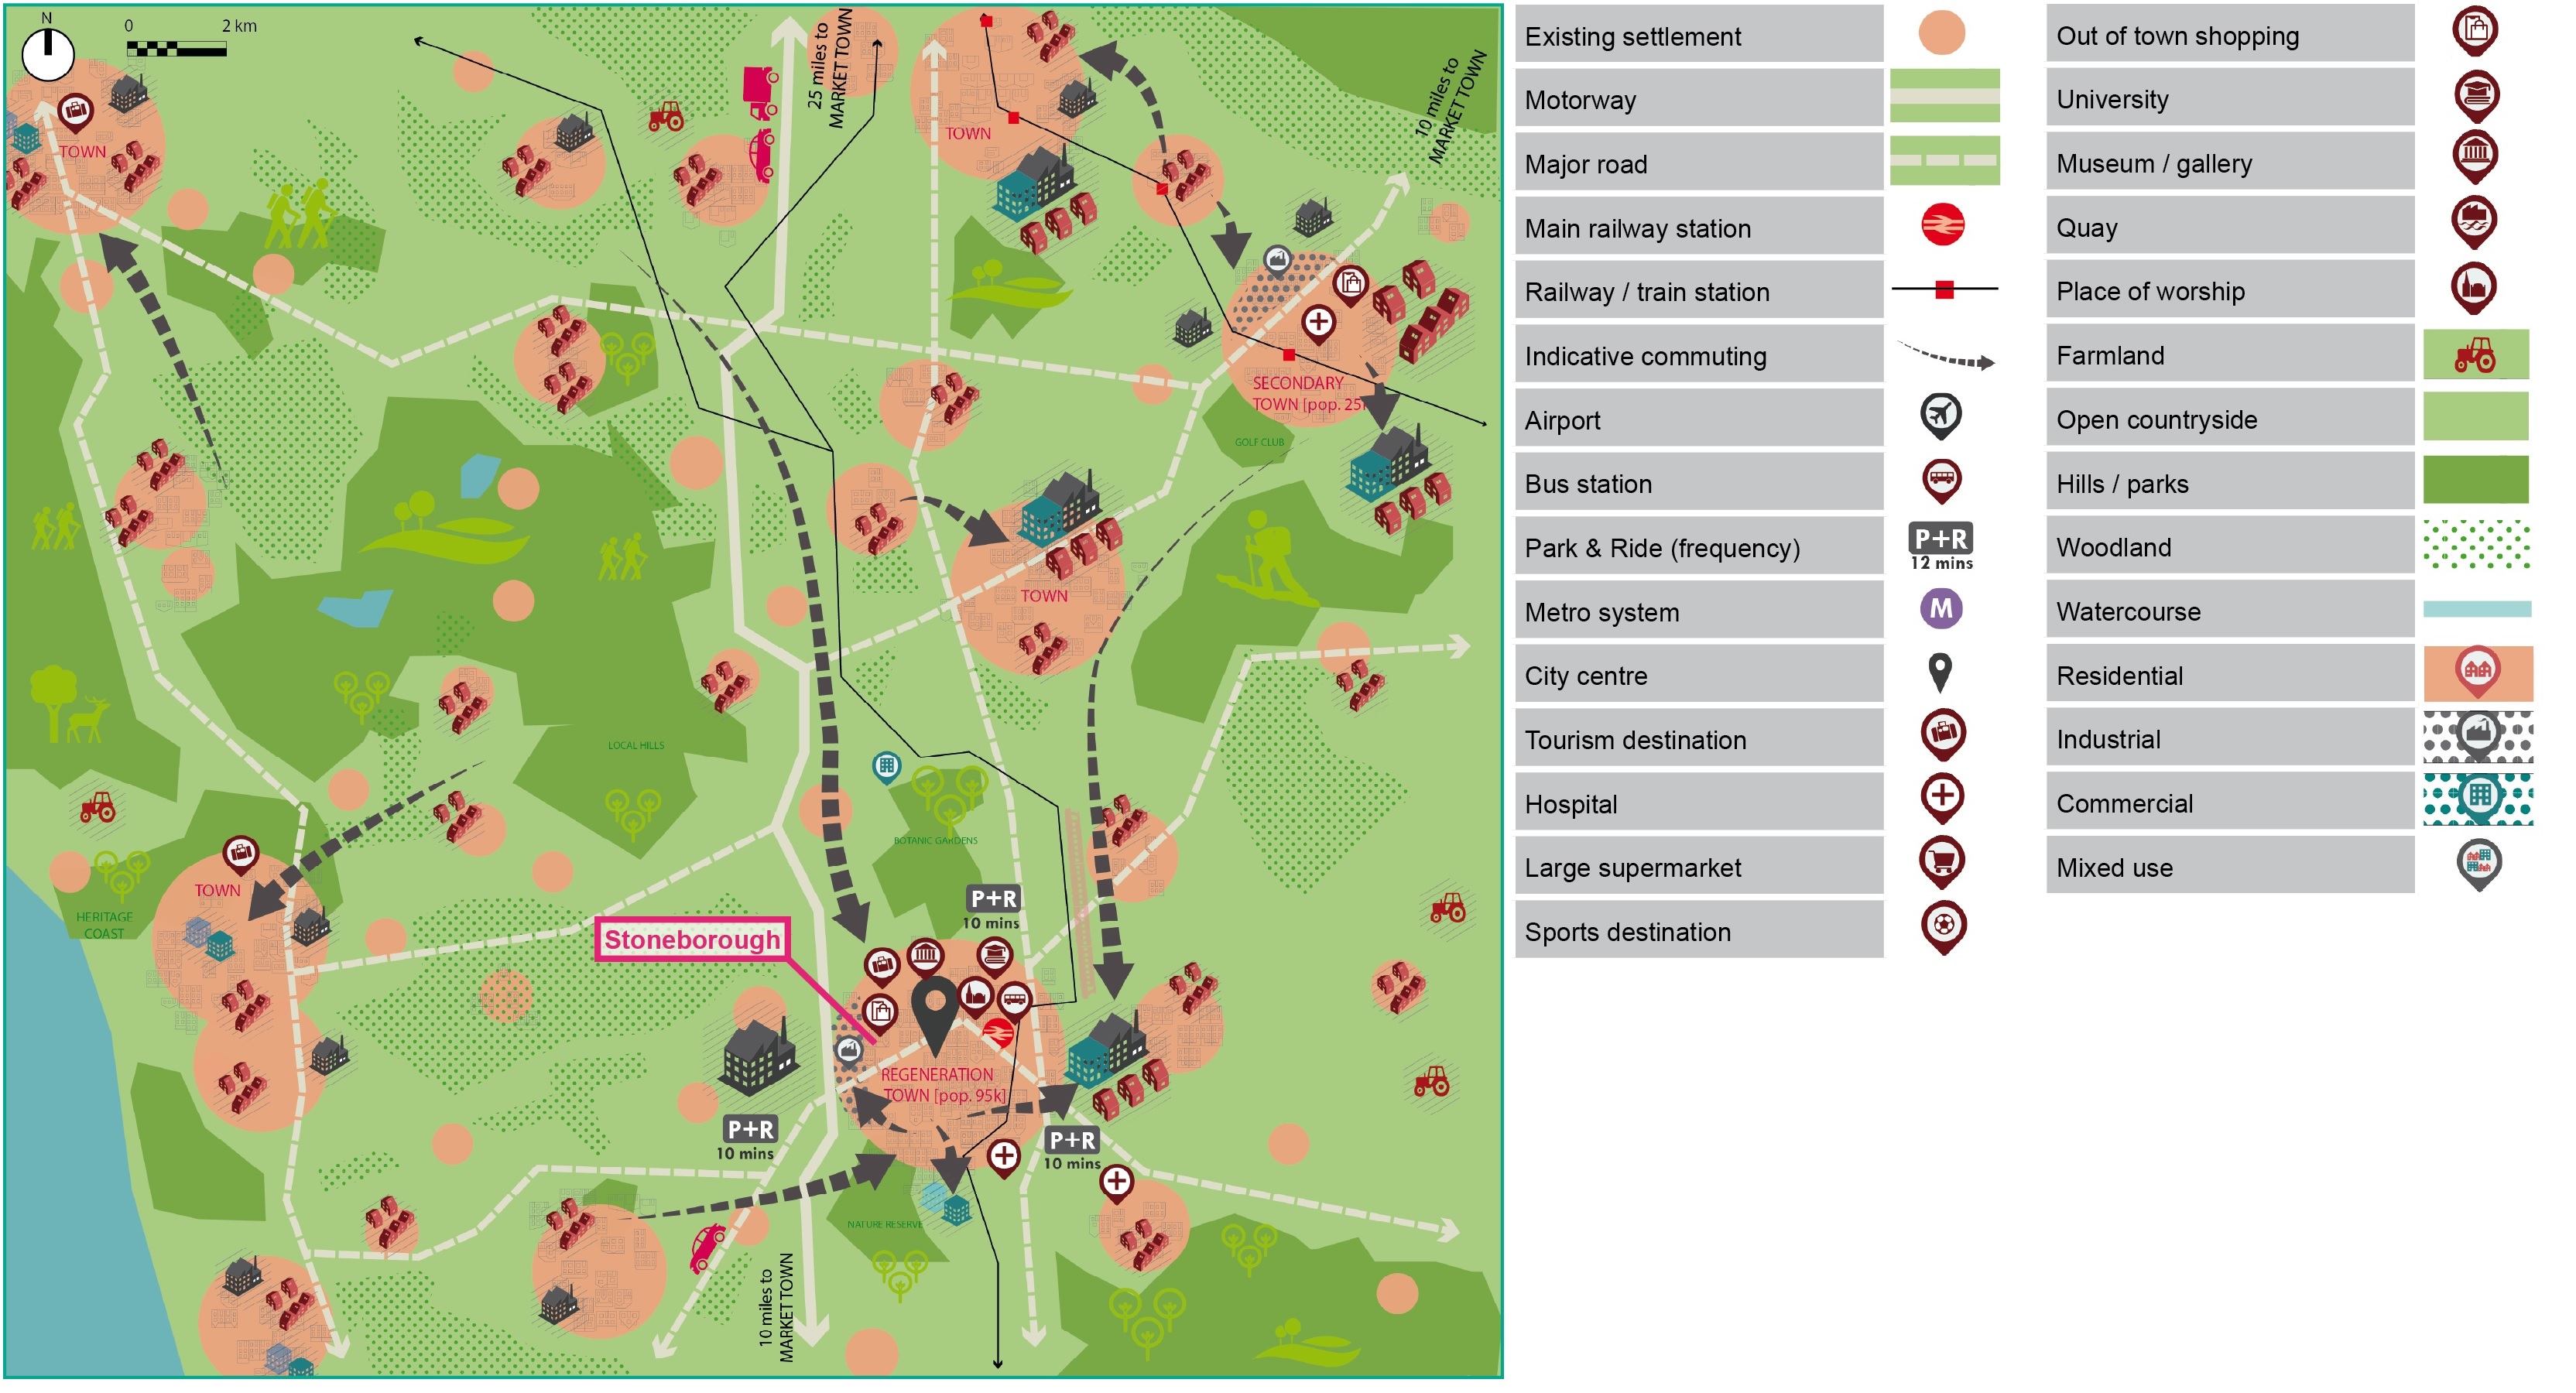
Population and housing: A medium sized town of 25,000 people, set within a post-industrial region of approximately 150,000 people. Extensive land is available to meet projected housing need, but low land values and property prices, and high land remediation costs, present a barrier to growth and development without public sector support.
Economy and employment: Traditional mining and heavy industries have declined, leaving manufacturing, skilled trades, health, social services and elementary occupations as the main sources of employment. There is significant deprivation in skills, earnings and health, with many neighbourhoods among the most deprived in England. Regeneration efforts focus on trying to reposition the town as a regional tourism destination, drawing on its industrial heritage, landscape and investment in culture.
Travel and transport: There are high levels of out-commuting to employment sites on the periphery of the town, which attract in-commuting from the wider area. The public transport network is mainly comprised of buses, with a rail station providing connections to nearby towns and a mainline station within 30 minutes, but with poor integration between train and bus services. The surrounding countryside is heavily modified by industrial activity and not subject to landscape or ecological designations, but has comparatively good access through restoration schemes.
Welcome to Ebsham: a village in the county of Monteshire
Figure 2.4. Ebsham, set within the rural hinterland of Monteshire (click to expand)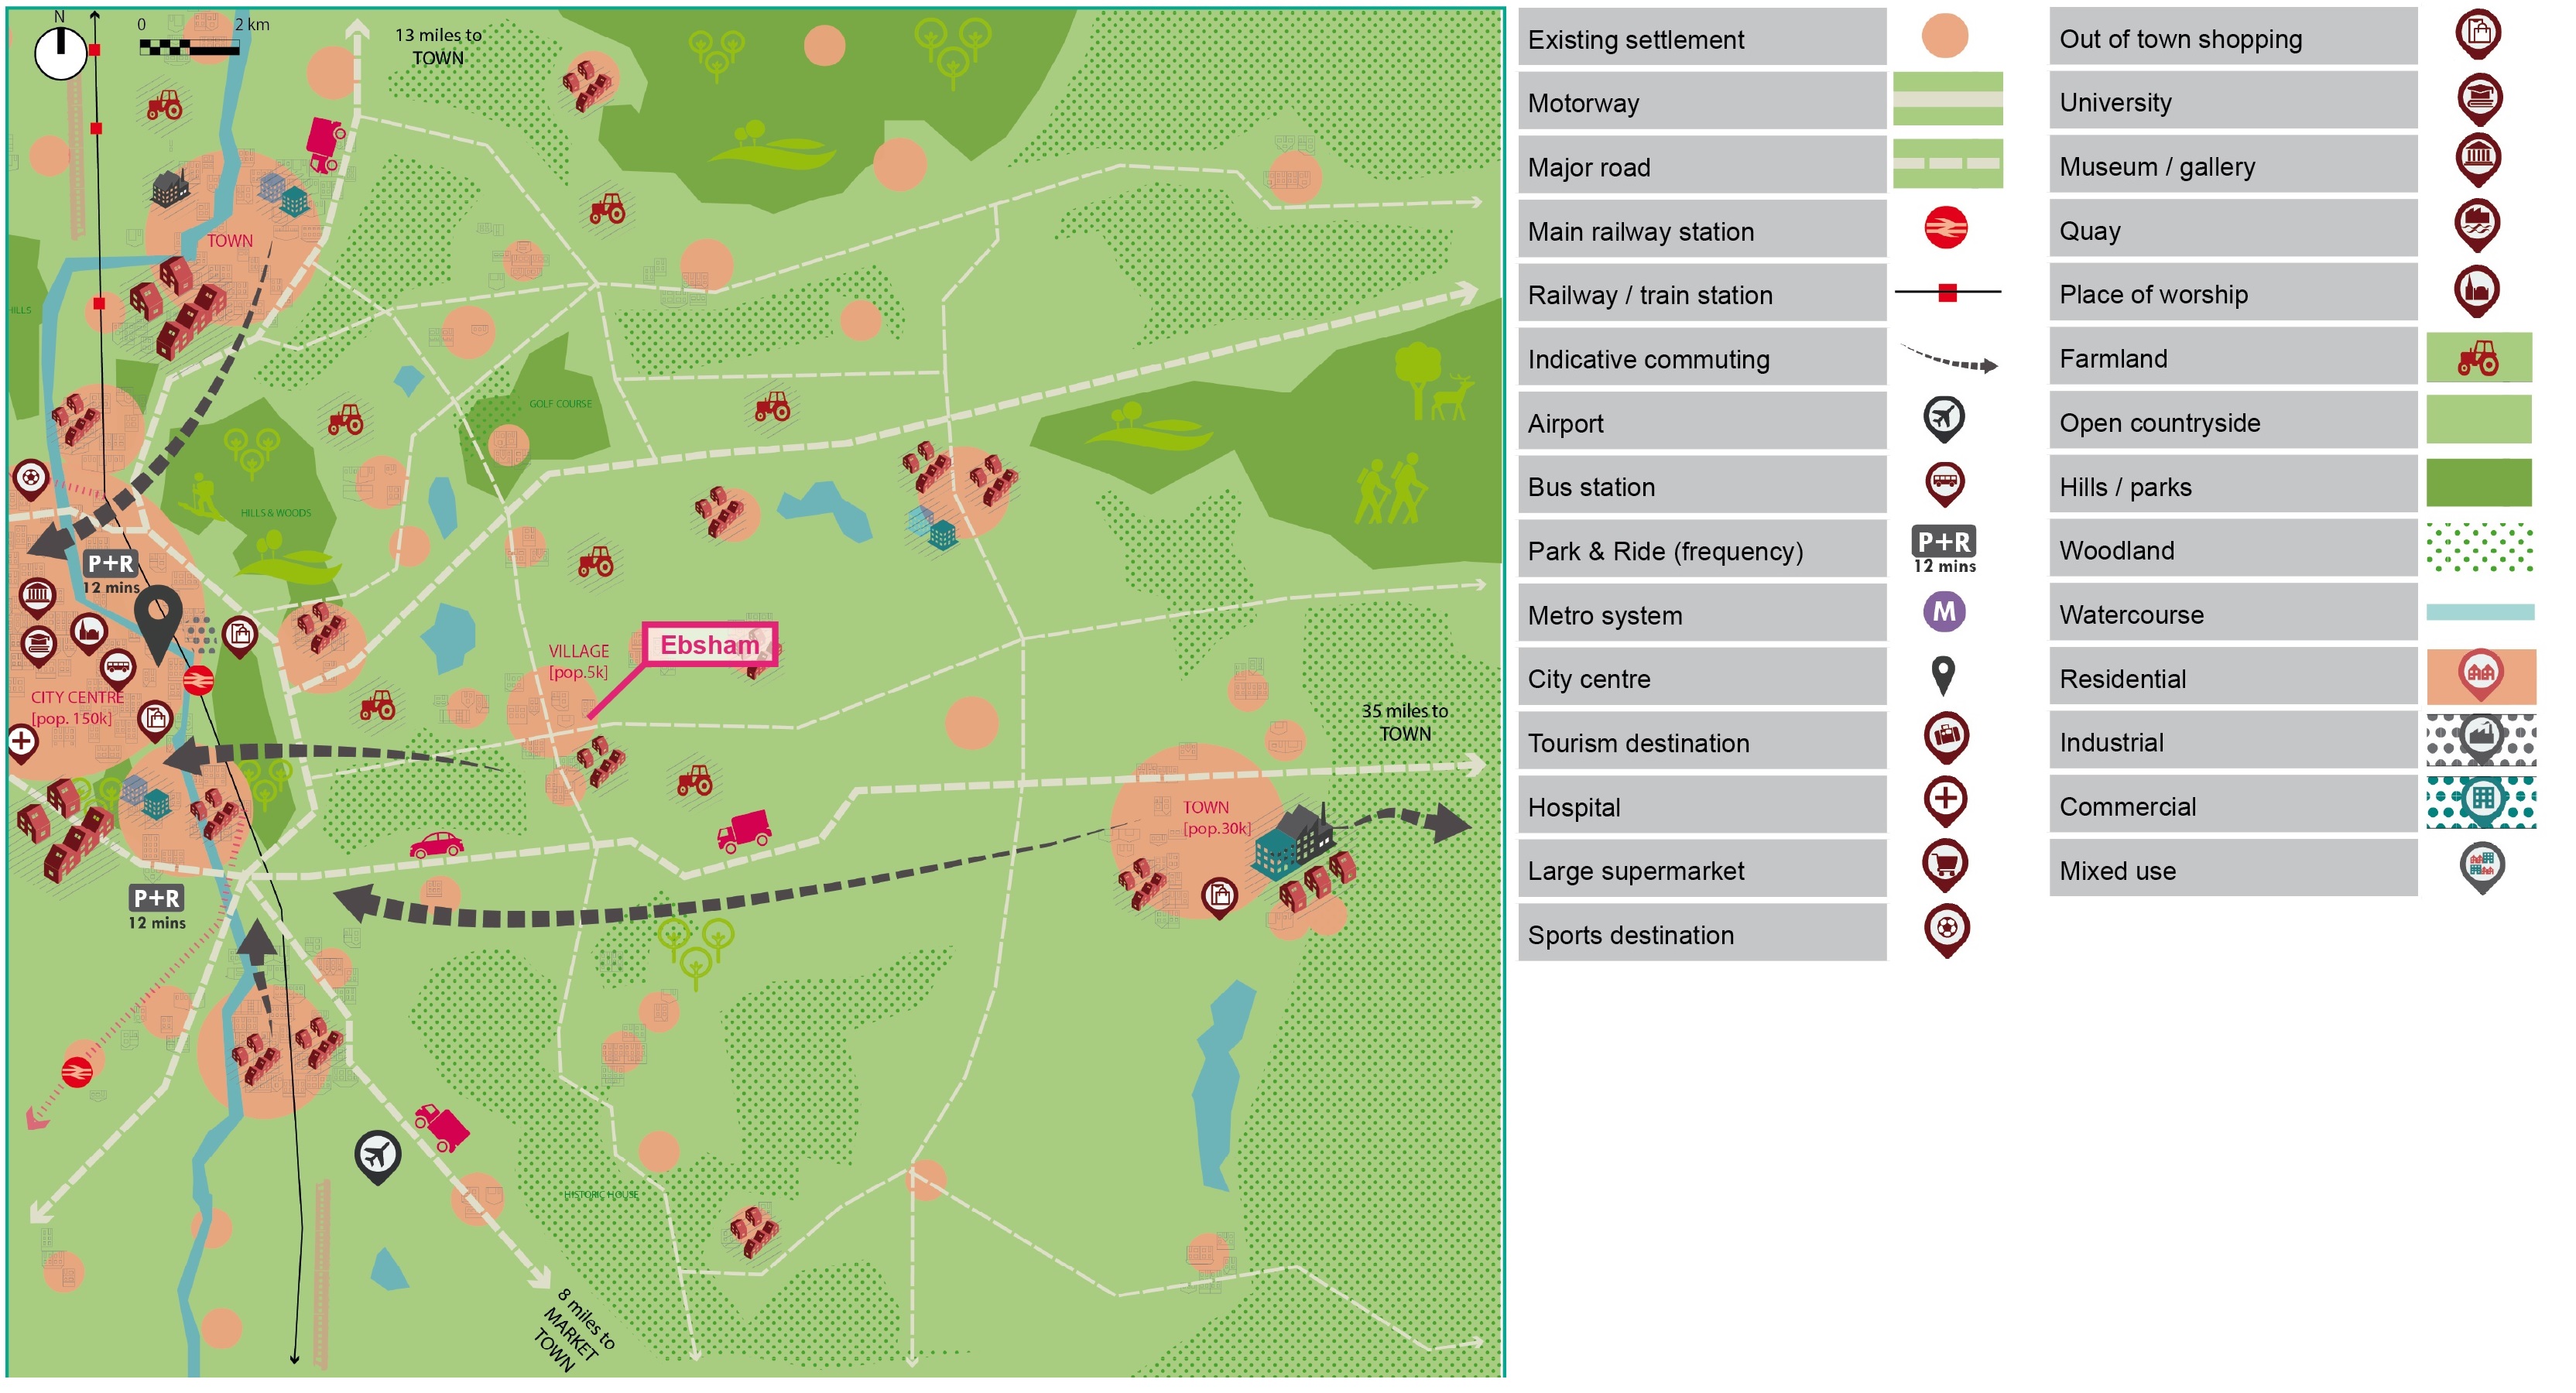
Population and housing: A village of approximately 5,000 people, located within commuting distance of a regional city, and set within a rural county with a dispersed settlement pattern and poor self-containment. High housing need, combined with a lack of brownfield sites and the small size of existing settlements, has created pressure for new standalone towns and villages on green field sites. However, much of the county is designated for landscape and ecological protection or as part of the Green Belt.
Economy and employment: A skilled and prosperous area with a high proportion of jobs in professional services, education, retail and healthcare.
Travel and transport: There is significant out-commuting from Ebsham and other small towns and villages in Monteshire to employment sites in the nearby city. The public transport network is weak: most areas are not served by the rail network, and bus services are slow and infrequent. Active travel infrastructure is very limited.
2.3. Stakeholder engagement
Forty stakeholders were selected to take part in the research, providing expertise from the public and private sectors representing urban design, planning authorities, developers, public transport and shared mobility operators.
Each stakeholder was allocated to one of the four typologies and provided with a base plan and pen portrait presenting its key characteristics in areas such as socio-demographics, housing, economy, transport, infrastructure and land use.
Stakeholders contributed through a combination of written exercises and two online workshops. Initially, they considered the carbon reduction interventions created by the project team and were invited to add additional interventions. They were then asked to rank interventions as high, medium or low priority based on the contribution they anticipated could be made to reducing carbon from transport and achieving better place outcomes. Discussions at the first workshop focussed on the merits of the highest ranking interventions, potential barriers to delivery and ways to overcome them.
Between the first and second workshop, the highest ranking interventions selected by stakeholders were modelled to consider the actual impact on carbon reduction. The results of this initial modelling informed discussions in the second workshop, which focused on additional interventions that stakeholders had previously identified as medium or low priority.
2.4. Using the Sustainable Accessibility and Mobility (SAM) Framework
This research started from the premise that a place-based approach to net zero transport should focus on solutions that create better places and healthier, happier, more resilient communities. These objectives are critical to good planning, linking the imperative to reduce transport emissions with wider objectives related to decarbonisation, housing growth and nature recovery.
This approach calls for measures that first focus on the role of place in reducing trips, before considering how to increase the proportion of the remaining trips that are taken by active, public and shared forms of transport.
This basic hierarchy is summarised in the ‘Sustainable Accessibility and Mobility (SAM) Framework’, a tool created by Vectos to help planners and designers prioritise interventions in the following order:
- Substitute Trips: Replace the need to travel beyond your community
- Shift Modes: For longer trips, use active, public and shared forms of transport
- Switch Fuels: For any trips that must be made by car, ensure the vehicle is zero emission
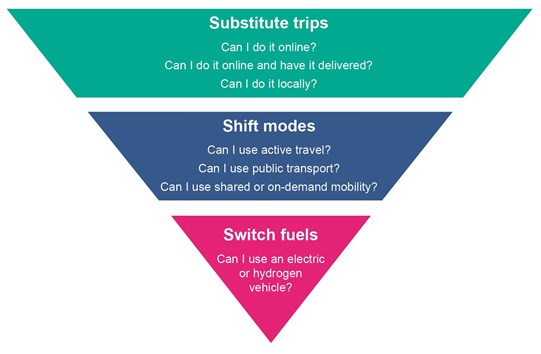
The SAM Framework was used to categorise and prioritise each of the interventions considered as part of this project and to provide a high-level structure for discussions with stakeholders, as set out in further detail below.
2.5. Testing carbon reduction interventions
Carbon disaggregation
This research used a carbon disaggregation model based on the UK territorial emissions table for local authorities, published by BEIS[19].
The disaggregation model first allocated terrestrial emissions to each of the four typologies examined in the study. For some places (e.g. the Wotton City-Region) this required the aggregation of local authority data, while for others (e.g. Ebsham) this required disaggregating emissions data. In the latter cases, the relevant local authority data were used and local emissions disaggregated on the basis of population.
The model then used trip purpose and mode share data drawn from the National Travel Survey (NTS), 2011 Census and regional road traffic data from the Department for Transport[20]. The model utilises an in-depth analysis of origin-destination trip patterns to establish commuting behaviours and emissions, and then uses relationships observed within the NTS to allocate carbon across all purposes and modes.
The results (for personal trips) were validated against a similar exercise undertaken by the DfT in 2008[21], while the impact of vehicle emission assumptions on the model were also validated using emission factors in DfT’s WebTAG. A full explanation of the approach to carbon modelling is provided in the Methodological Appendix.
Testing carbon reduction interventions
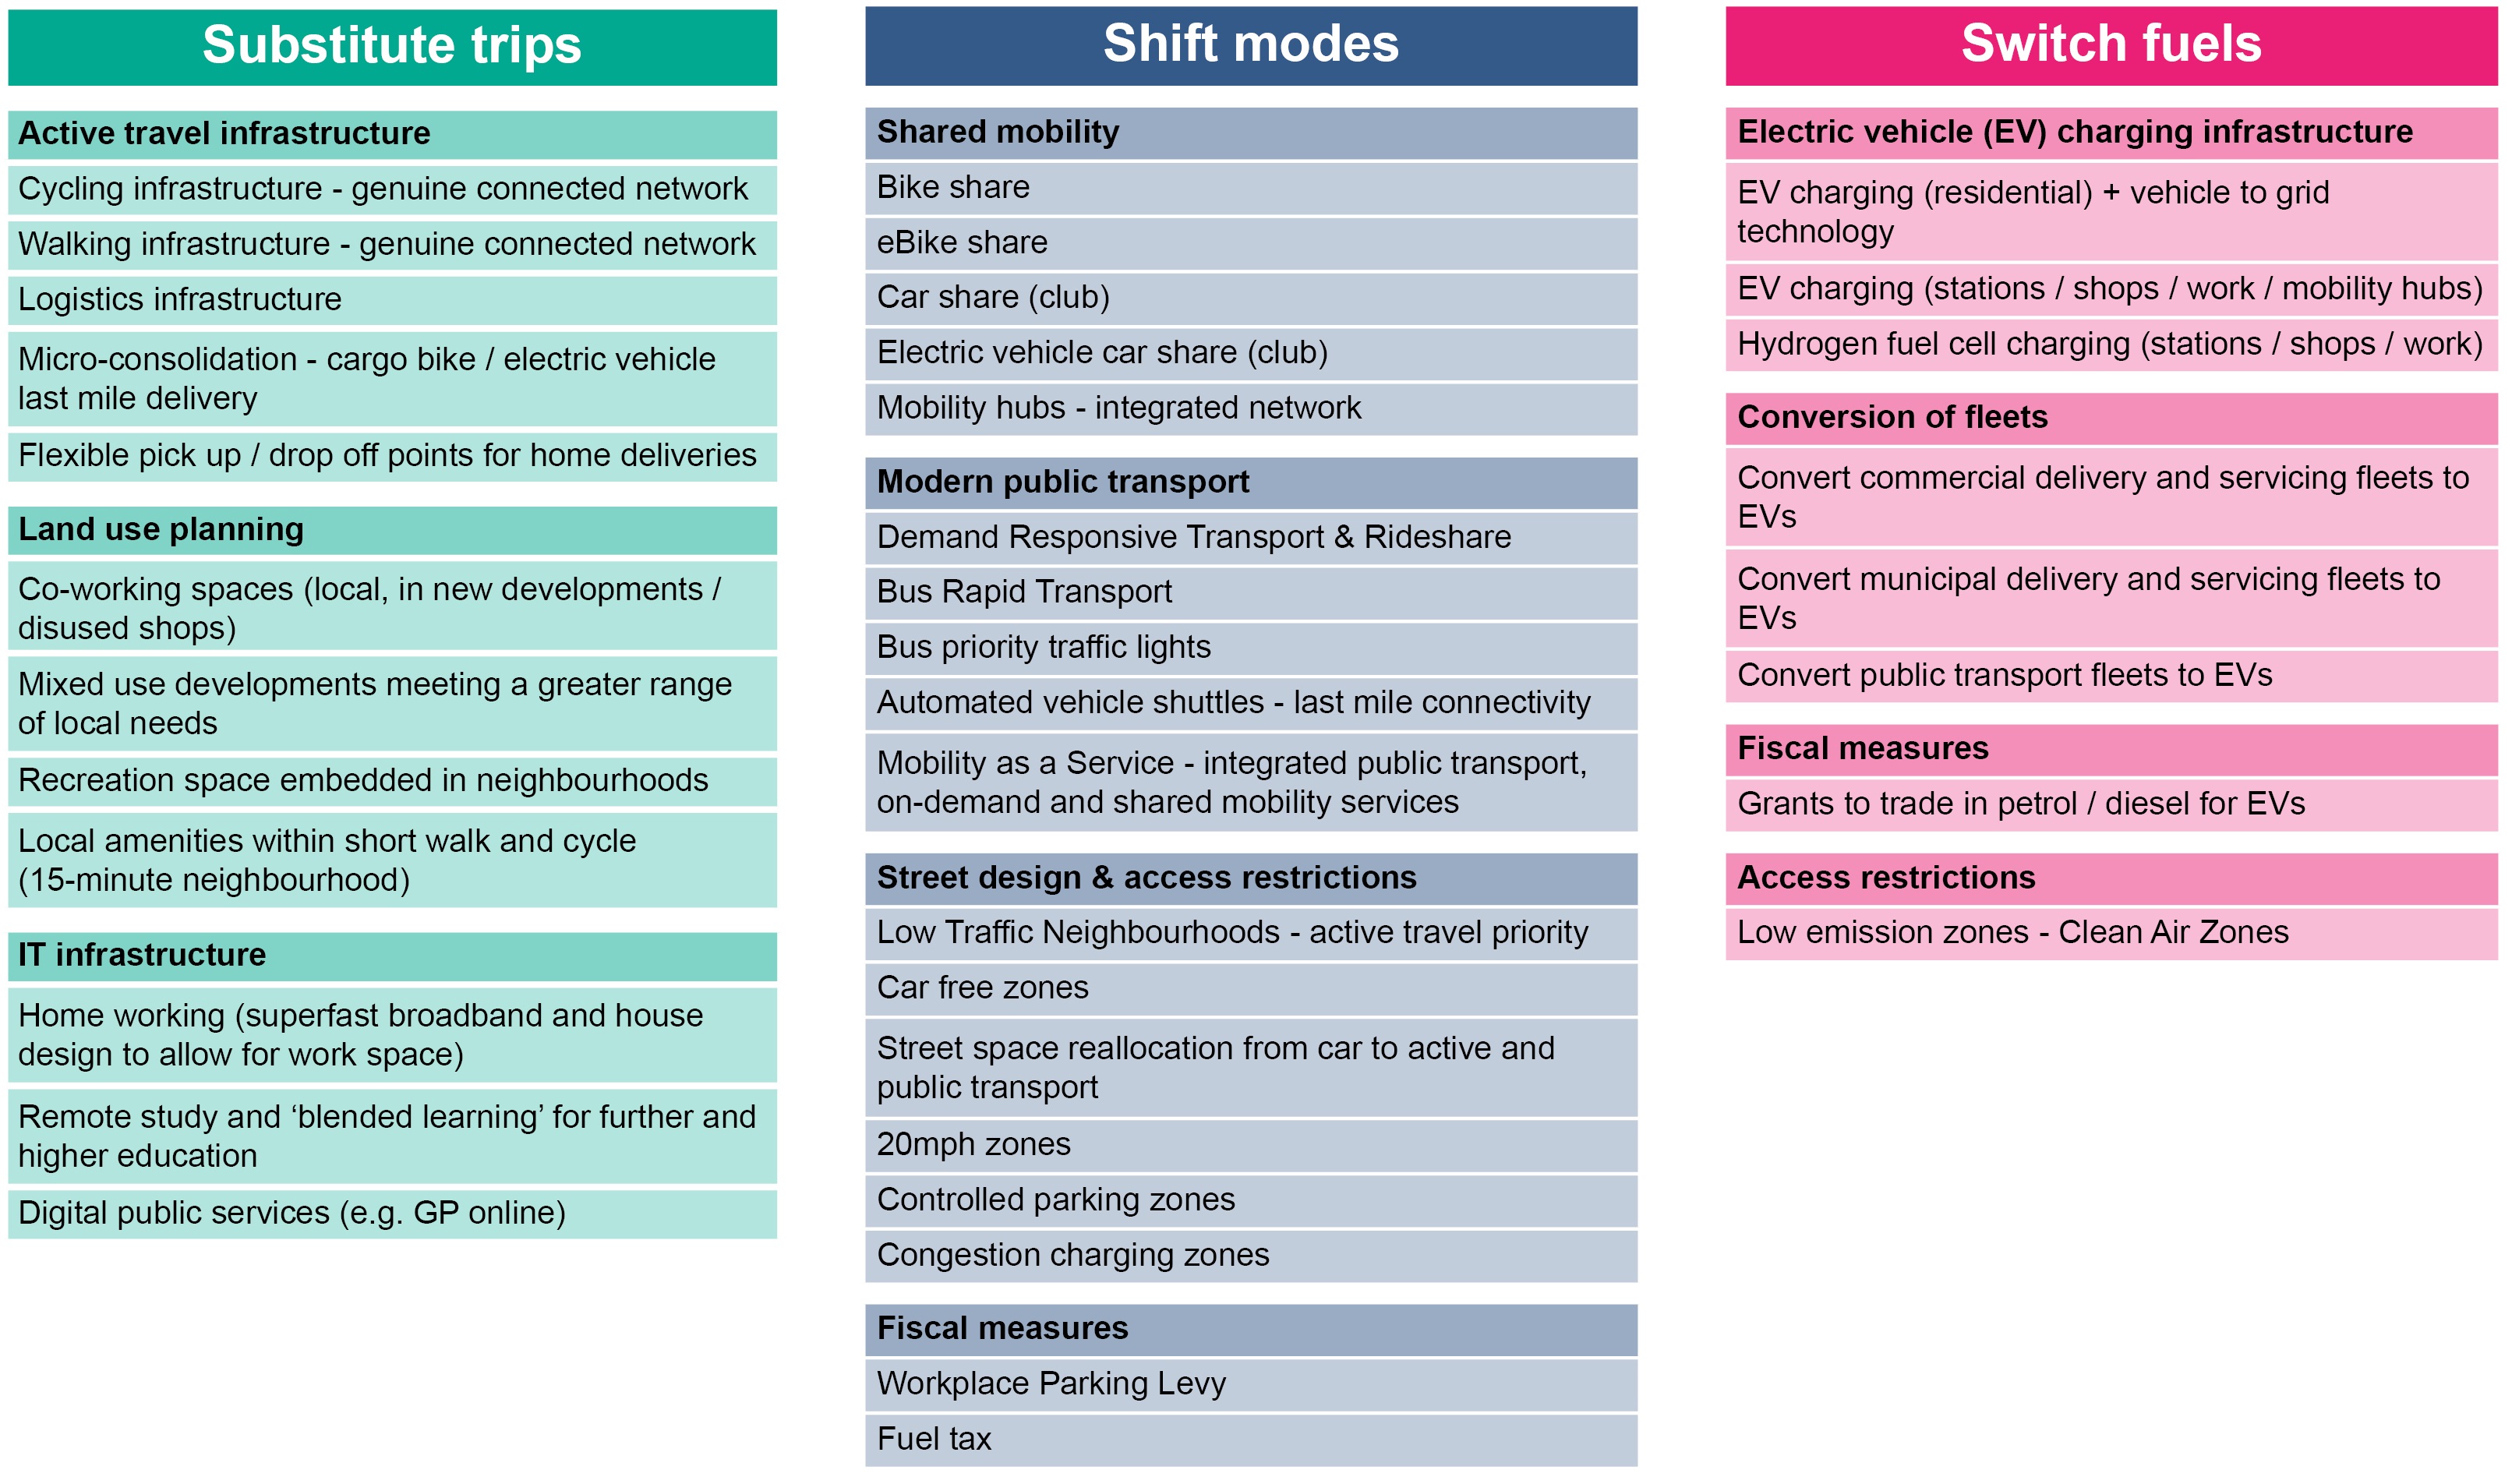
Having disaggregated carbon for each typology, approximately 40 interventions were considered that could reduce emissions from surface transport. A full list of the interventions is set out in Table 2.1. The carbon reduction impact on each intervention was modelled based on available academic and real-world evidence, and is summarised in relation to each intervention in the Methodological Appendix.
Individual interventions were sorted into 12 groups based on their general approach to reducing emissions and potentially overlapping outcomes. For example, the widespread adoption of ‘mobility as a service’ platforms assumes that a ‘modern transport network’ is already in place, and were sorted into the same group of interventions.
Finally, each of the 12 groups were placed within one of the three categories of the SAM Framework. This made it easier to discuss and compare priority interventions for the four typologies with stakeholders, and to create an emissions reduction pathway that prioritises place-based solutions and delivery of wider planning objectives.
To identify the emissions reduction pathway set out in Chapter 3, the carbon reduction evidence for individual interventions was converted into a series of assumptions, striking a balance between evidence for what has been achieved in the past, and ambition for what could feasibly be possible. These assumptions are explained further in the Methodological Appendix.
The pathway was modelled on a hierarchical basis, in line with the SAM Framework. This means that the impact of interventions that ‘substitute trips’ (i.e. reducing the need to travel) was modelled first, before considering what the additional impact of interventions in the ‘shift modes’ category would be. The impact of interventions to ‘switch fuels’ was only considered once all interventions in the first two categories of the SAM Framework had been modelled, ensuring that fuel switching is only used to eliminate residual carbon emissions.
Table 2.1. Interventions, grouped according to the SAM framework (click to expand)
Findings
3.1. We need to plan for a ‘do everything’ carbon scenario
Following the approach set out in Chapter 2, this research found that no single intervention, or even combination of interventions, will achieve the required 80% reduction in surface transport emissions by 2030, in any of the four typologies.
Furthermore, in order to achieve an 80% reduction, progress in reducing the number of trips and increasing the share of journeys made via walking, cycling and electric public transport will need to substantially exceed the ‘best practice scenarios’ that previous evidence from the UK suggests is possible. This is a reflection of how far behind the transport sector is on the journey to decarbonisation, and points to the need to pursue a ‘do everything’ scenario.
It indicates an urgent need to move away from the traditional ‘predict and provide’ approach that continues to form the basis for much of the UK’s transport planning, and towards a ‘vision and validate’ approach that sets clear targets for trip reduction, mode share and carbon emissions. These targets, and the wider vision they sit within, need to form the basis of a policy framework that supports the planning, funding and delivery of the necessary interventions.
Importantly, many of the interventions needed to achieve these targets are outside the scope of what is traditionally considered as ‘transport planning’. Effective implementation is dependent on a much more integrated approach to transport and land use planning - one that puts carbon reduction first.
3.2. A pathway to net zero surface transport
This research identified a potential pathway to an 80% reduction in surface transport emissions by 2030. The pathway is hierarchical, following the approach summarised in Chapter 2.
The first step assumes that all new development is planned, designed and delivered in a way that achieves net zero transport emissions, and ideally to be ‘negative carbon’ by helping to reduce transport emissions at a wider scale. The following steps then reflect the three categories of the SAM Framework, with the carbon impact of interventions modelled sequentially.
Step 2 prioritises interventions that reduce the overall need to travel, while Step 3 shifts modes away from private vehicles and towards walking, cycling and public transport, while also enhancing the provision of traditional public transport. Step 4 covers the switch away from Internal Combustion Engines (ICEs) towards zero carbon fuels such as electricity and hydrogen.
It is important to note that this final step plays an important role in decarbonisation, but will not reduce trips and energy consumption or deliver place-benefits for people and communities. Therefore, planning needs to focus on keeping private trips to a minimum and providing alternative modes for trips that need to be made. This will ensure that private road-based transport is only used for residual trips that genuinely cannot be removed or undertaken by other modes, following the necessary investment in place and infrastructure.
As there is a decade to achieve the 80% target, all steps along the pathway need to be taken at the same time in order to make the necessary reductions. These steps are explained in further detail below.
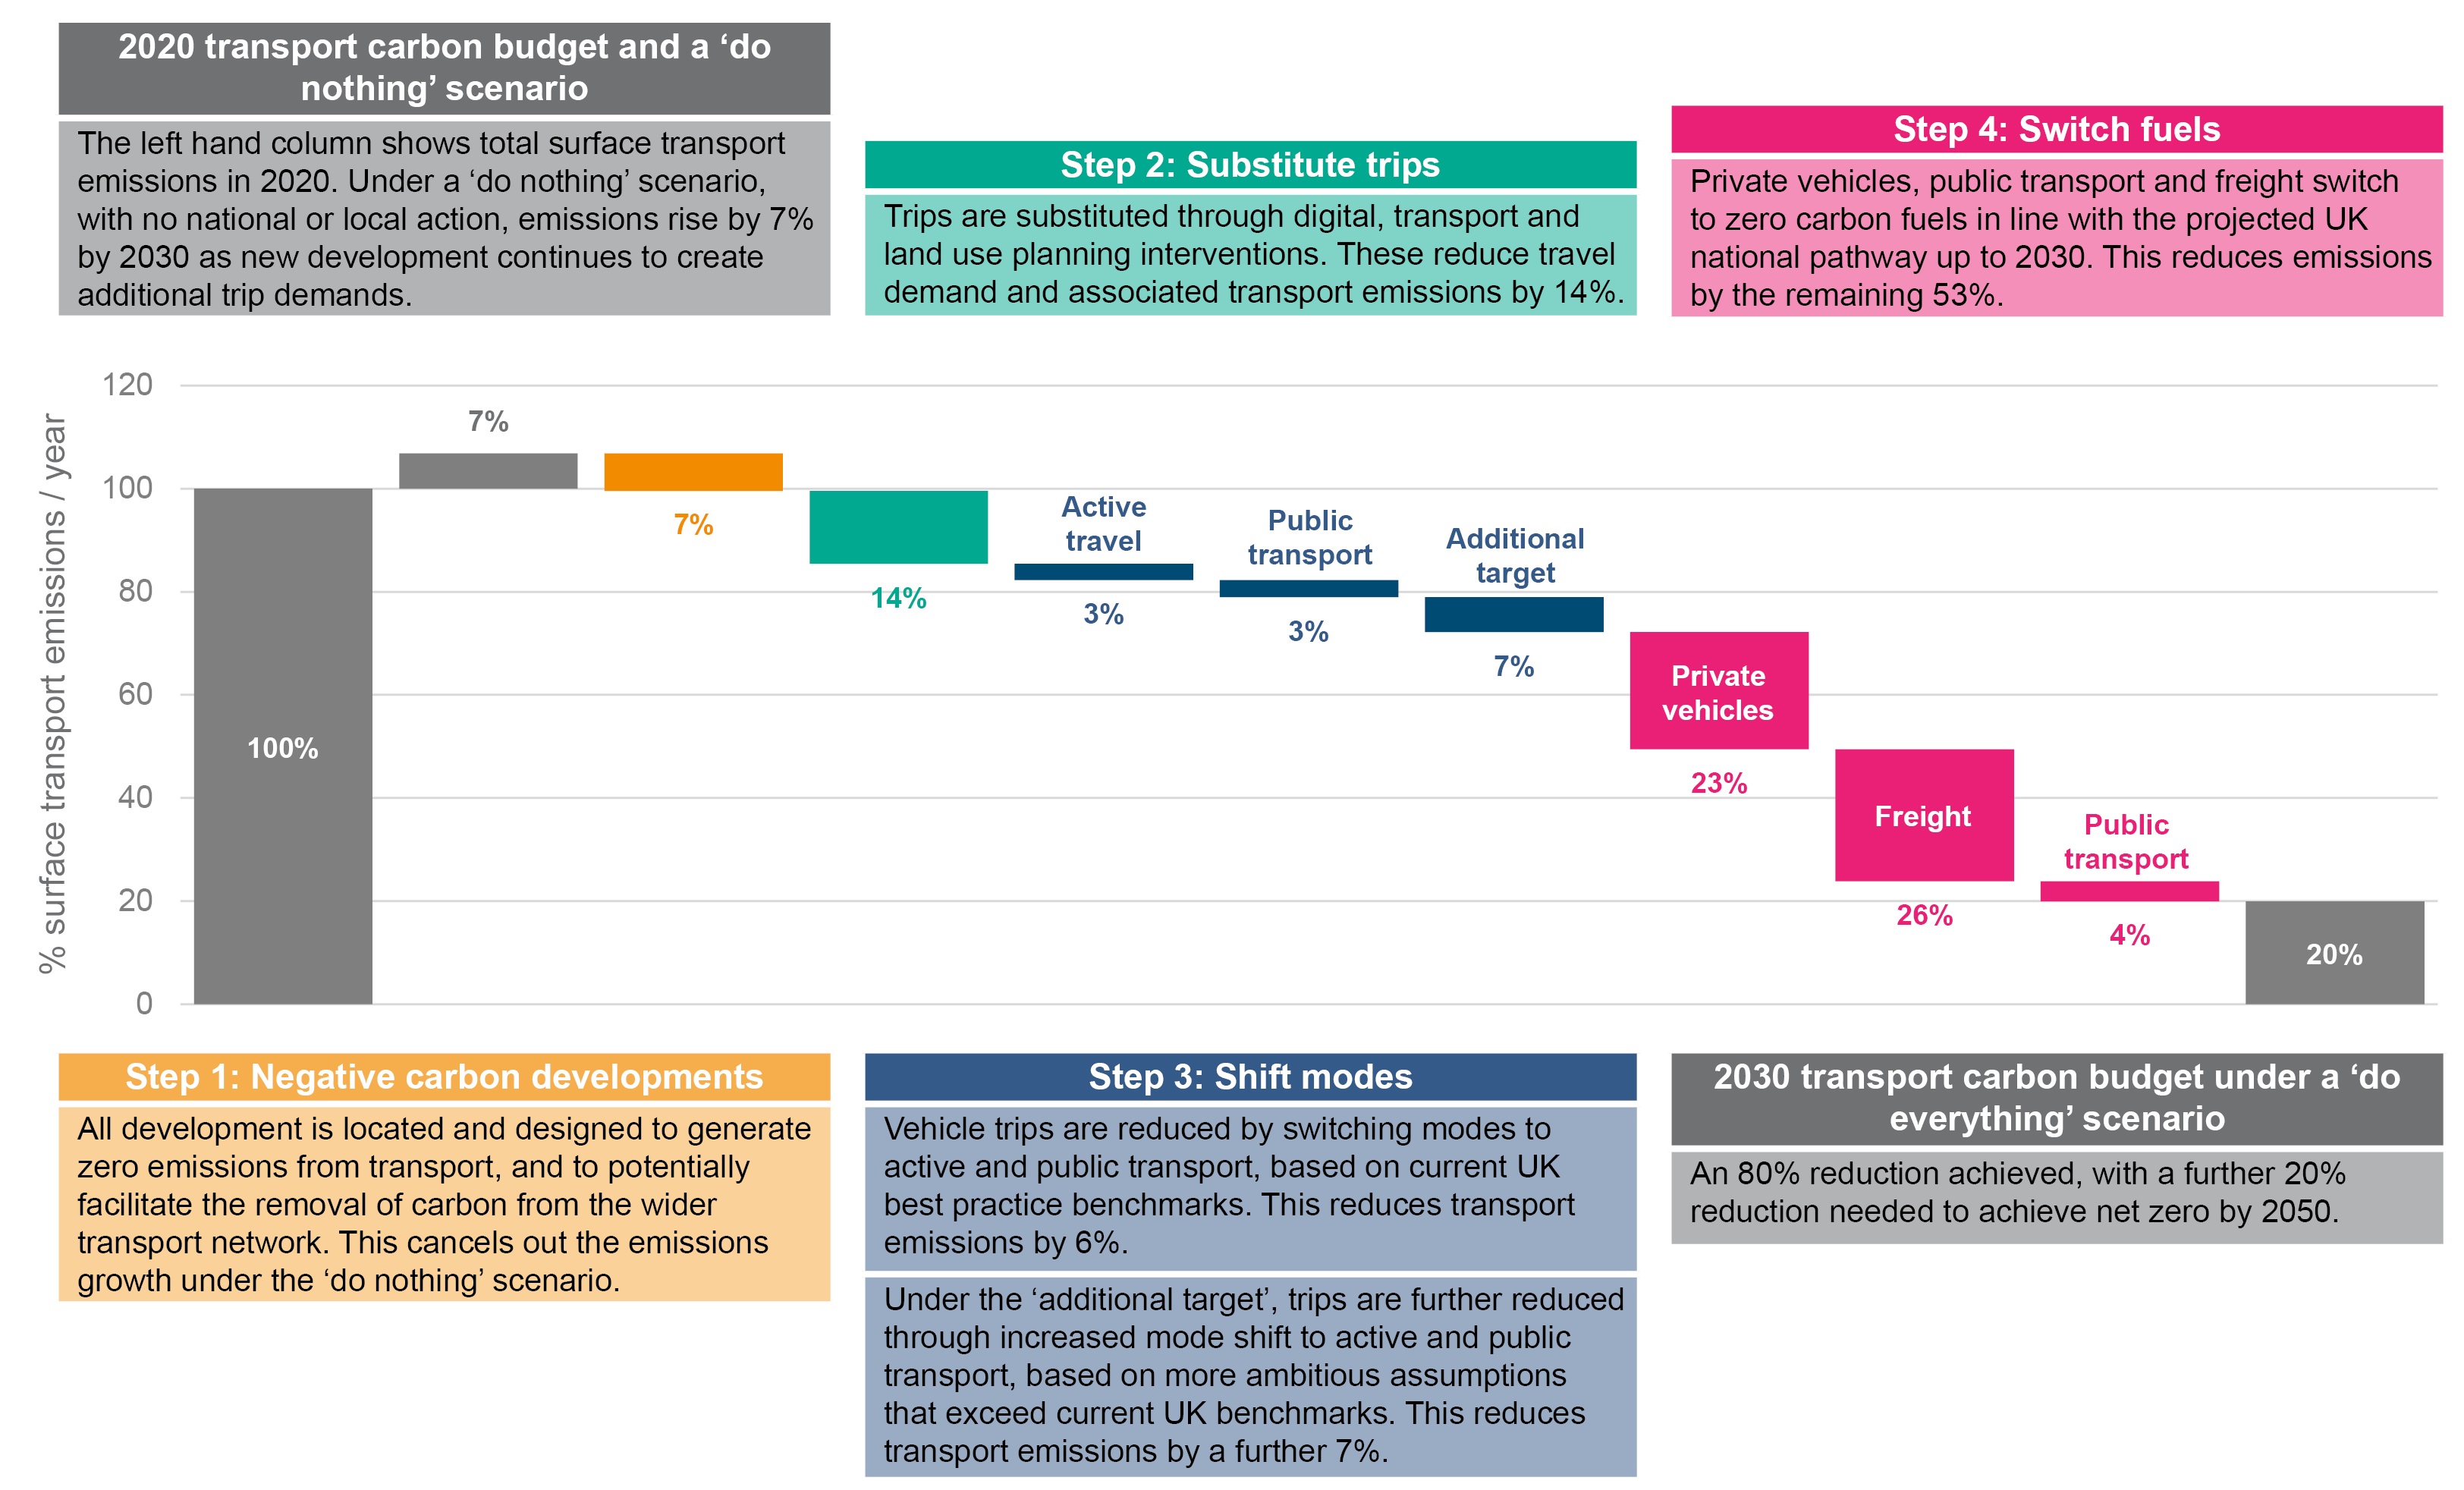
The pathway to decarbonisation is broadly similar across the four place typologies used in this project. This is illustrated in the ‘waterfall’ graph below, which shows the potential emission reductions that could be achieved when averaged across the four place typologies. Individual waterfall graphs for each place typology are included in Chapter 4.
Figure 3.1. An 80% carbon reduction pathway for 2020 to 2030 (average across the four place typologies) (click to expand)
3.3. The four pathway steps, explained
Step 1: Zero carbon as a precondition for growth
Step 1 ensures that no new transport emissions are created. For all four typologies, the modelling shows that a ‘do-nothing’ scenario leads to increased emissions, reflecting the fundamentally unsustainable nature of current transport and land-use planning. This could worsen if government continues to pursue policies to increase the scale and pace of housing delivery without ensuring that net zero transport emissions are a guiding principle and condition of all new development.
Retrofitting carbon reduction is difficult and expensive. It is therefore essential that all new development is planned, designed and delivered to achieve net zero transport emissions. Ideally, development should be carbon negative, demonstrating wider carbon reduction benefits by providing infrastructure that enables other places to decarbonise.
Step 2: Demand reduction through local living
Step 2 maximises the potential to reduce travel demand by making use of home-working and digital service delivery, and by making it easier for people to access the services and activities they need locally through the concept of 15-minute neighbourhoods and local living. Mobility restrictions imposed to control the Covid-19 pandemic have highlighted both the importance of proximity to local services, amenities and outdoor spaces, and rates of home working which far exceed previous assumptions[22].
The principles of local living and greater home-working must be applied in all new development and through area-based renewal and regeneration of existing places. Based on the potential impacts assumed, the modelling shows that demand reduction could reduce transport emissions by around 14% in each typology.
Step 3: Mode shift away from private vehicles to walking, cycling and public transport
Step 3 ensures that mode shift to walking, cycling, public and shared transport is promoted and achieved, going beyond the UK’s existing ‘best practice’ benchmarks. Figure 3.1 illustrates the potential carbon reductions from mode share changes based on existing UK benchmarks, and additional targets which exceed these.
For example, to achieve the current UK ‘best practice’ benchmarks for the Wotton City-Region, the mode share for walking and cycling must increase by 10% for short journeys and 6% for longer journeys, while the mode share for public transport must increase by 24% for short journeys and 14% for longer journeys. In this typology, these changes reduce transport emissions by 13%.
To move significantly beyond the UK benchmark requires either further reductions in longer-distance trips or the switching of these trips to public transport. The modelling shows a further 7% modal shift to public transport could further reduce transport emissions in the Wotton City-Region by 5%.
For smaller settlements, UK best practice does not provide a particularly ambitious benchmark. For Castlemore to match the current UK benchmark, the mode share for active travel would have to increase by 6% for short journeys and 4% for long distance journeys. The mode share for public transport would only have to increase by 3% over all distances. These changes would reduce carbon by only 4%. Similar emission reductions from mode shift would also occur in Stoneborough and Ebsham. This is clearly insufficient to deliver the necessary reduction in emissions by 2030.
The research therefore modelled the contribution of a more ambitious mode share target, where a greater proportion of longer-distance trips are served by public transport. This moves the level of ambition beyond the current UK best practice benchmark by assuming that 40% of longer-distance trips could be served by public transport.
The model also accounts for current implied occupancy. In Stoneborough, for example, the additional public transport mode share for longer distance trips has limited impact on the basis of current occupancy. Actions would therefore need to be taken to increase occupancy in order to maximise the benefits of an increased public transport mode share.
In the short-term, the Covid-19 pandemic has had a severely negative impact on public transport. It is unclear how quickly service provision and occupancy will recover to pre-pandemic levels, let alone exceed them, in light of changed travel habits during 2020 and possible residual public health concerns around public transport once restrictions have ended. Measures to restore public confidence in public transport are likely to be necessary, alongside measures to ensure that it is an attractive and viable alternative to the private car for a wider range of people.
Step 4: Fuel switching
Step 4, the final step, ensures that residual emissions are addressed through zero emission fuels. The transition to electric/hydrogen vehicles and zero carbon freight and public transport still has a considerable role to play in each typology (between 45% and 55%) despite the ambitious demand reduction and mode share initiatives assumed in the previous steps. These changes also potentially go beyond existing national policy, which is estimated to account for 40% of the proposed fuel-switching impacts by 2030. This implies that accelerated local action to promote fleet and infrastructure decarbonisation will be essential to deliver an 80% reduction in transport emissions.
Despite similarities in the interventions needed to achieve an 80% reduction across the four place typologies, the implementation of this pathway would need to be tailored to local circumstances in order to meet community needs and maximise placemaking benefits. These are explored in the following chapter.
4. Planning for net zero transport
4.1. A new model of spatial planning
The modelling and stakeholder engagement carried out during this research demonstrates that, without radical change, our transport and land use planning systems are not going to deliver the net zero outcomes needed to meet our legal targets and avoid catastrophic climate change.
The planning system in England has become overly focused on the promotion, allocation and servicing of land to deliver homes and commercial development, without giving meaningful consideration to the impact on carbon emissions or the important role of placemaking in facilitating local living. Reform often focuses on facilitating the current business model of private developers, rather than the creation of good quality homes in sustainable communities that are fit for the future[23].
Meanwhile, the transport planning system often remains constrained by the traditional approach of predicting demand and providing road capacity to meet it, instead of focusing on trip reduction and the promotion of active and public transport as genuine alternatives to the private car.
The transport and land use planning systems are therefore dependent on each other to deliver the outcomes we need, but each operates largely in isolation[24].
Our research supports the case for a radical shift to a new model of integrated spatial planning, underpinned by a strong place vision and focused on the delivery of ambitious, cross-cutting outcomes. These outcomes need to look beyond numerical housing targets, road capacity and expectations of architectural design. At the most basic level, spatial planning needs to make ‘net zero’ outcomes a prerequisite of new development, and a priority for urban renewal. This alone requires a significant uplift in ambition compared to the current approach.
But if spatial planning is to deliver net zero at pace, while addressing other challenges such as high street decline, habitat loss, inequality and deprivation, we need to be even more ambitious. The planning system must set clear expectations for truly sustainable development, and be capable of delivering the right outcomes.
These outcomes must cover all of the elements that combine to create great places, such as accessible local amenities for work and leisure, child-friendly liveable streets, multifunctional green infrastructure, and a sense of place and belonging that encourages people to live locally and travel less.
Outcomes need to be rooted in bold visions for the future. These should not just seek to manage, mitigate and regulate change, but rather work to proactively initiate and shape change in order to achieve better outcomes – ones that are tailored to the needs, circumstances and potential of different places. This must take place while delivering the national imperative to eliminate emissions from surface transport.
The potential pathway to decarbonisation identified through this research (summarised in Figure 3.1) shows that technological solutions, such as the mainstream uptake of EVs, will still play a key role in reducing emissions. But without a bold vision focused on mode share targets, place-based solutions and the achievement of wider planning objectives, they will not reduce travel demand or create the places we need. On the contrary, Ofgem estimates that by 2050, the use of EVs may need to increase from 230,000 today to 46 million in order to meet the UK’s net zero target[25]. This would lock-in the car dependent lifestyles which have already contributed to the health, social and environmental challenges faced today.
Instead, spatial planning needs to create visions for the future that are designed to facilitate and encourage new forms of local living on an everyday basis. They must also ensure that places are designed to maximise the availability, connectivity and use of walking, cycling and public transport networks. By necessity, this will involve reducing the dominance of private vehicles to create the space needed for new forms of development, infrastructure and spaces that stand a credible chance of facilitating behaviour change at the required scale. This will not be easy, but it is necessary.
Sections 4.2 and 4.3.set out what a new model of spatial planning could look like, alongside the building blocks that could facilitate a place-based approach to net zero transport through local living and integrated mobility.
4.2. Spatial planning principles and building blocks for a net zero built environment
Figure 4.1. Core spatial planning principles to facilitate local living, trip reduction and sustainable mobility (click to expand)
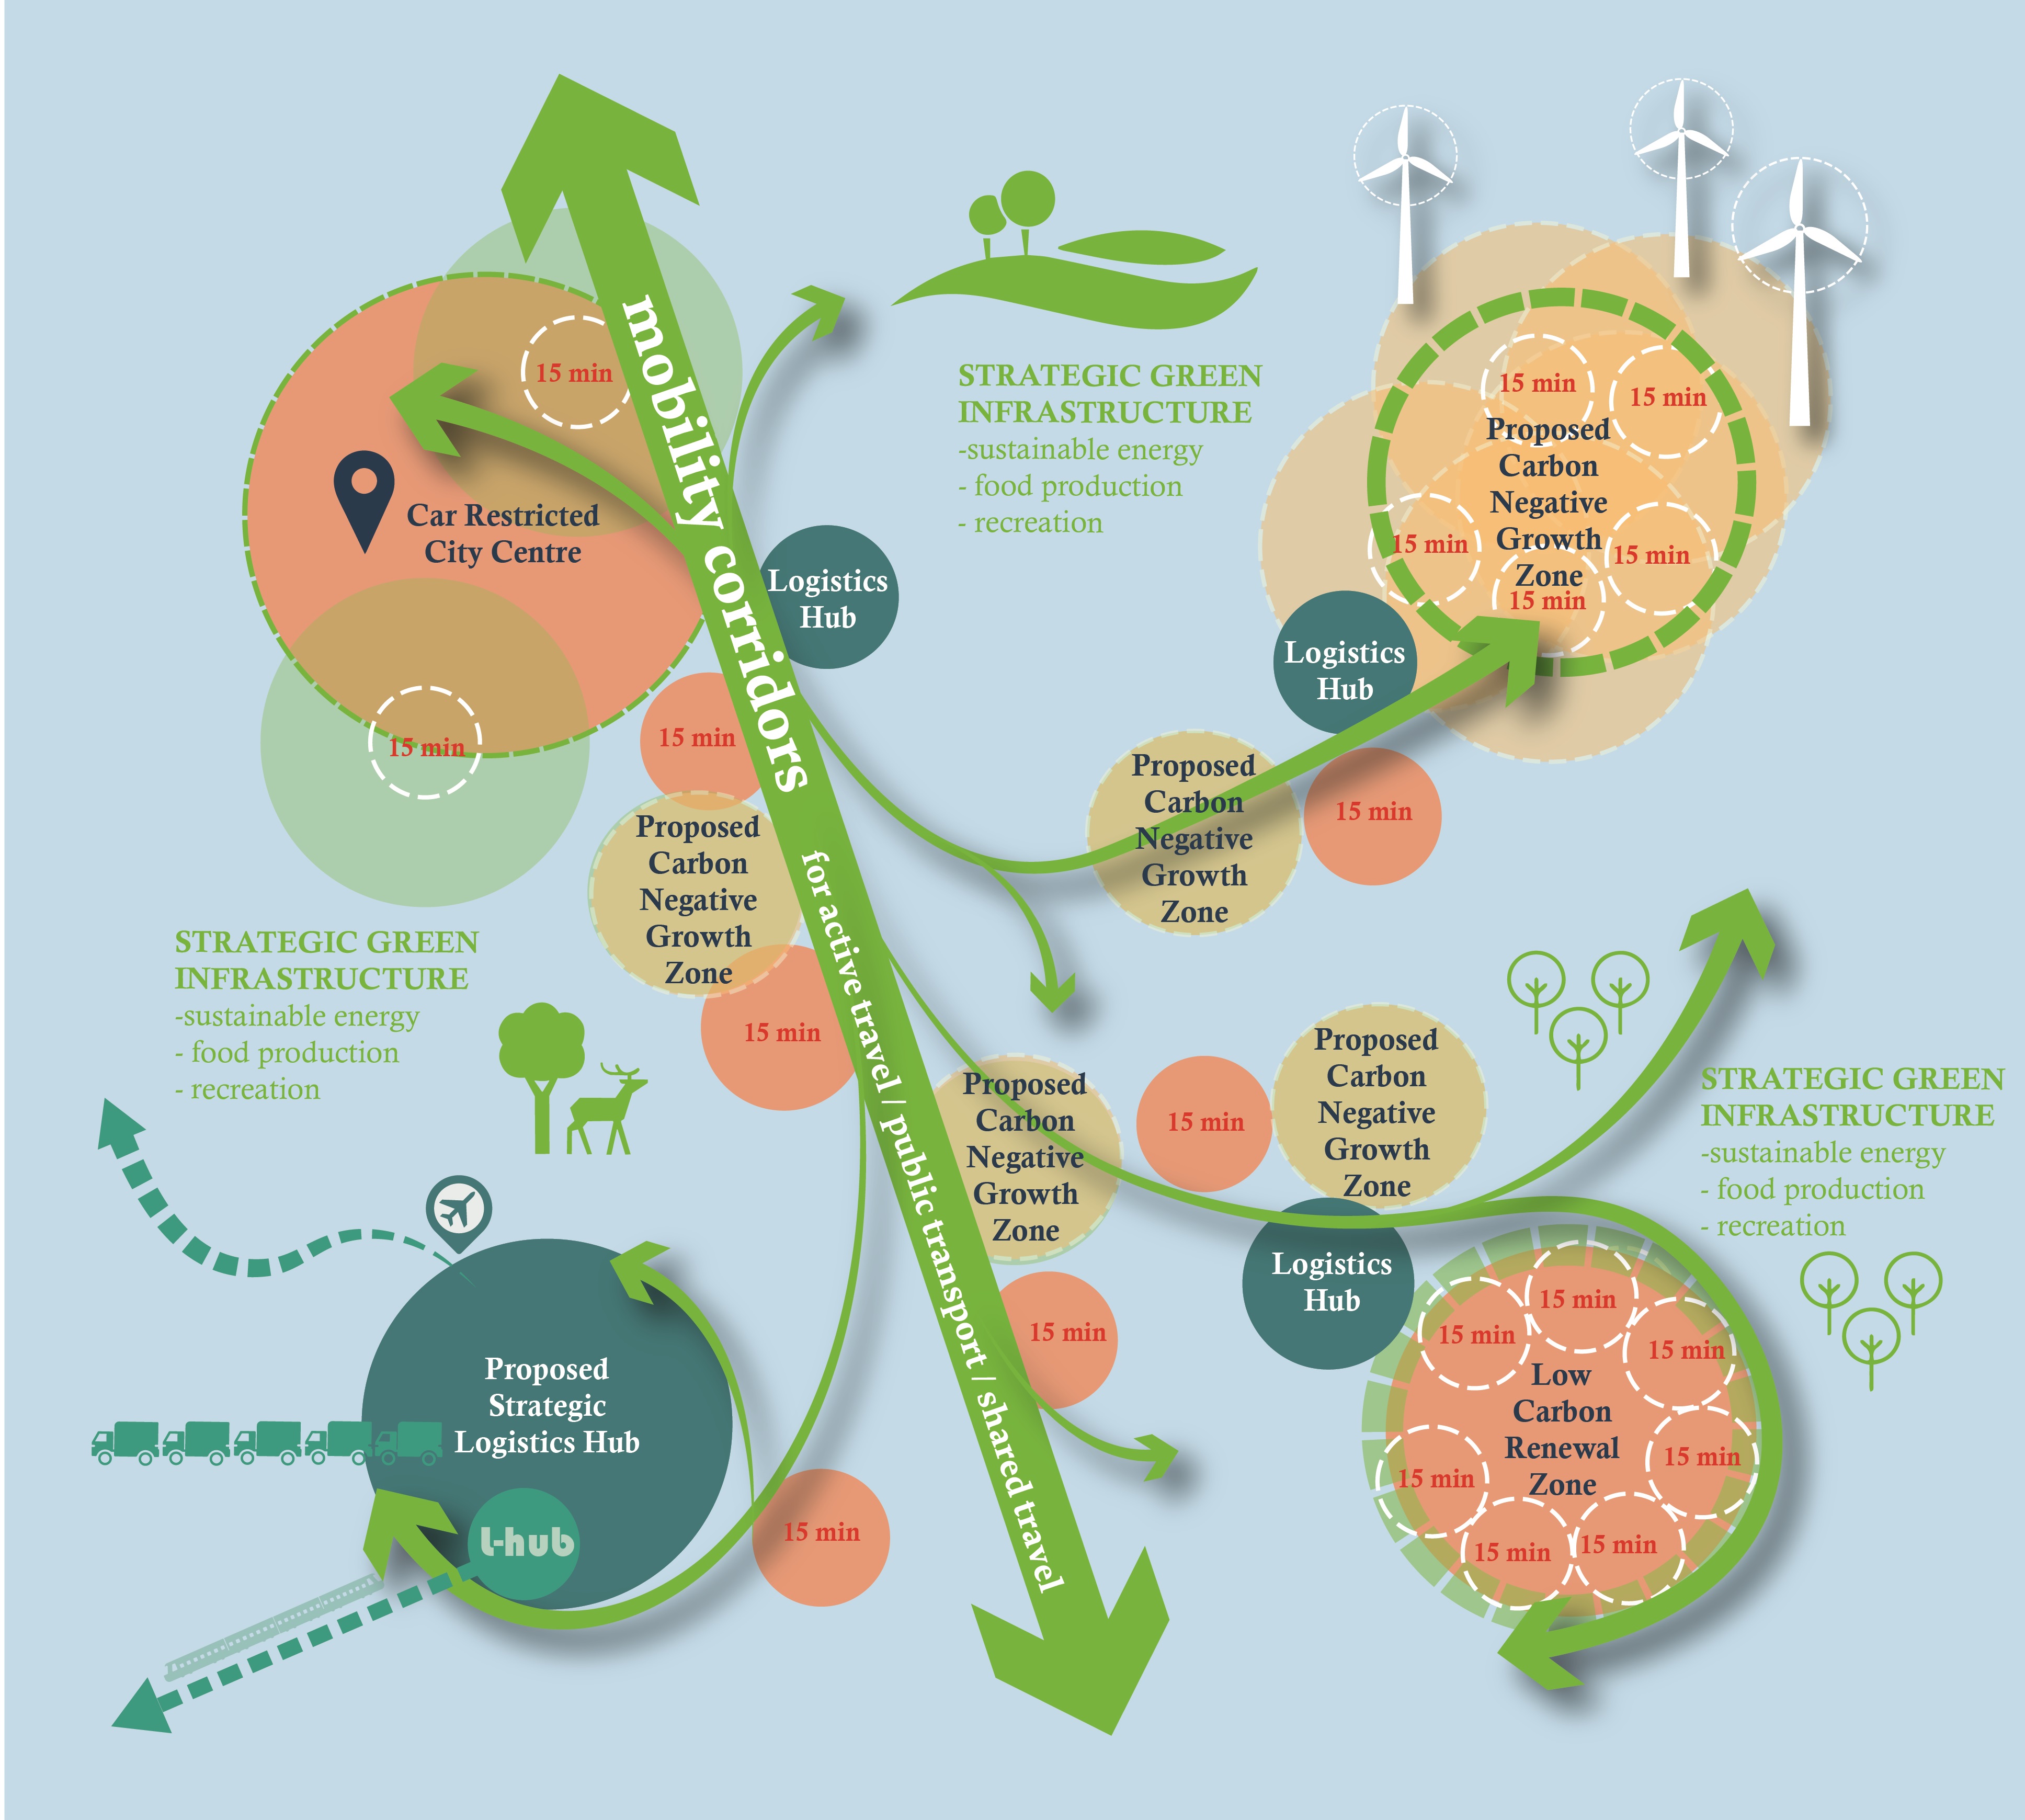
Figure 4.1. shows the core spatial planning principles to facilitate local living, trip reduction and sustainable mobility within and between settlements. At the heart of this model is the principle that place based solutions to net zero transport should be the key determinants when ‘zoning’ land for development or protection through the planning system. This principle is reflected in three key concepts: the Carbon Negative Growth Zone, Low Carbon Renewal Zone, and Strategic Green Infrastructure.
Firstly, new growth and development (such as urban extensions, garden towns and villages) should be planned, designed and delivered on the basis of achieving ‘Carbon Negative Growth’. This means development should not only deliver net zero transport outcomes from day one, but should contribute to carbon reduction on a wider scale through reducing travel demand, enabling mode shift and facilitating the switch to cleaner fuels on the existing network. While this research focuses on net zero transport, the principle of ‘Carbon Negative Growth’ should be extended to other aspects of development in support of the wider decarbonisation agenda.
Secondly, this shows that urban renewal will be essential to reduce existing travel demand and redesign existing streets and spaces around active and public transport. It will also be necessary to enable micro-consolidation and low carbon logistics. This change is unlikely to come about through ad-hoc development in built up areas, and will instead require a coordinated approach to regeneration, redevelopment and the reorientation of transport networks around sustainable modes. The creation of Low Carbon Renewal Zones could provide a framework to better understand the challenges and opportunities of achieving net zero transport within existing areas, and enable the development of a structured programme to implement measures that reduce emissions and deliver wider placemaking benefit for existing communities.
Many places across the world have begun the process of reorienting transport networks in their town and city centres. We suggest this approach could be taken up more widely and accelerated in the UK as part of urban renewal. However, in order to achieve net zero, a ‘whole place’ approach will ultimately be needed to achieve the necessary reductions in emissions and maximise place benefits for communities.
Finally, strategic green infrastructure should play a greater role in achieving net zero transport, improving local access while offering opportunities for tranquillity and recreation, and creating a stronger link between the productive rural economy and local logistics networks.
The ways in which planning can help to achieve net zero transport will differ depending on local circumstances, and on the balance of interventions made to substitute trips, shift modes and shift fuels.
The following pages set out key building blocks that could play a critical role as part of a place-based approach to net zero transport, and which are reflected in the visions for the four place typologies set out at the end of this chapter.
Figure 4.2: The 15-minute neighbourhood (click to expand)
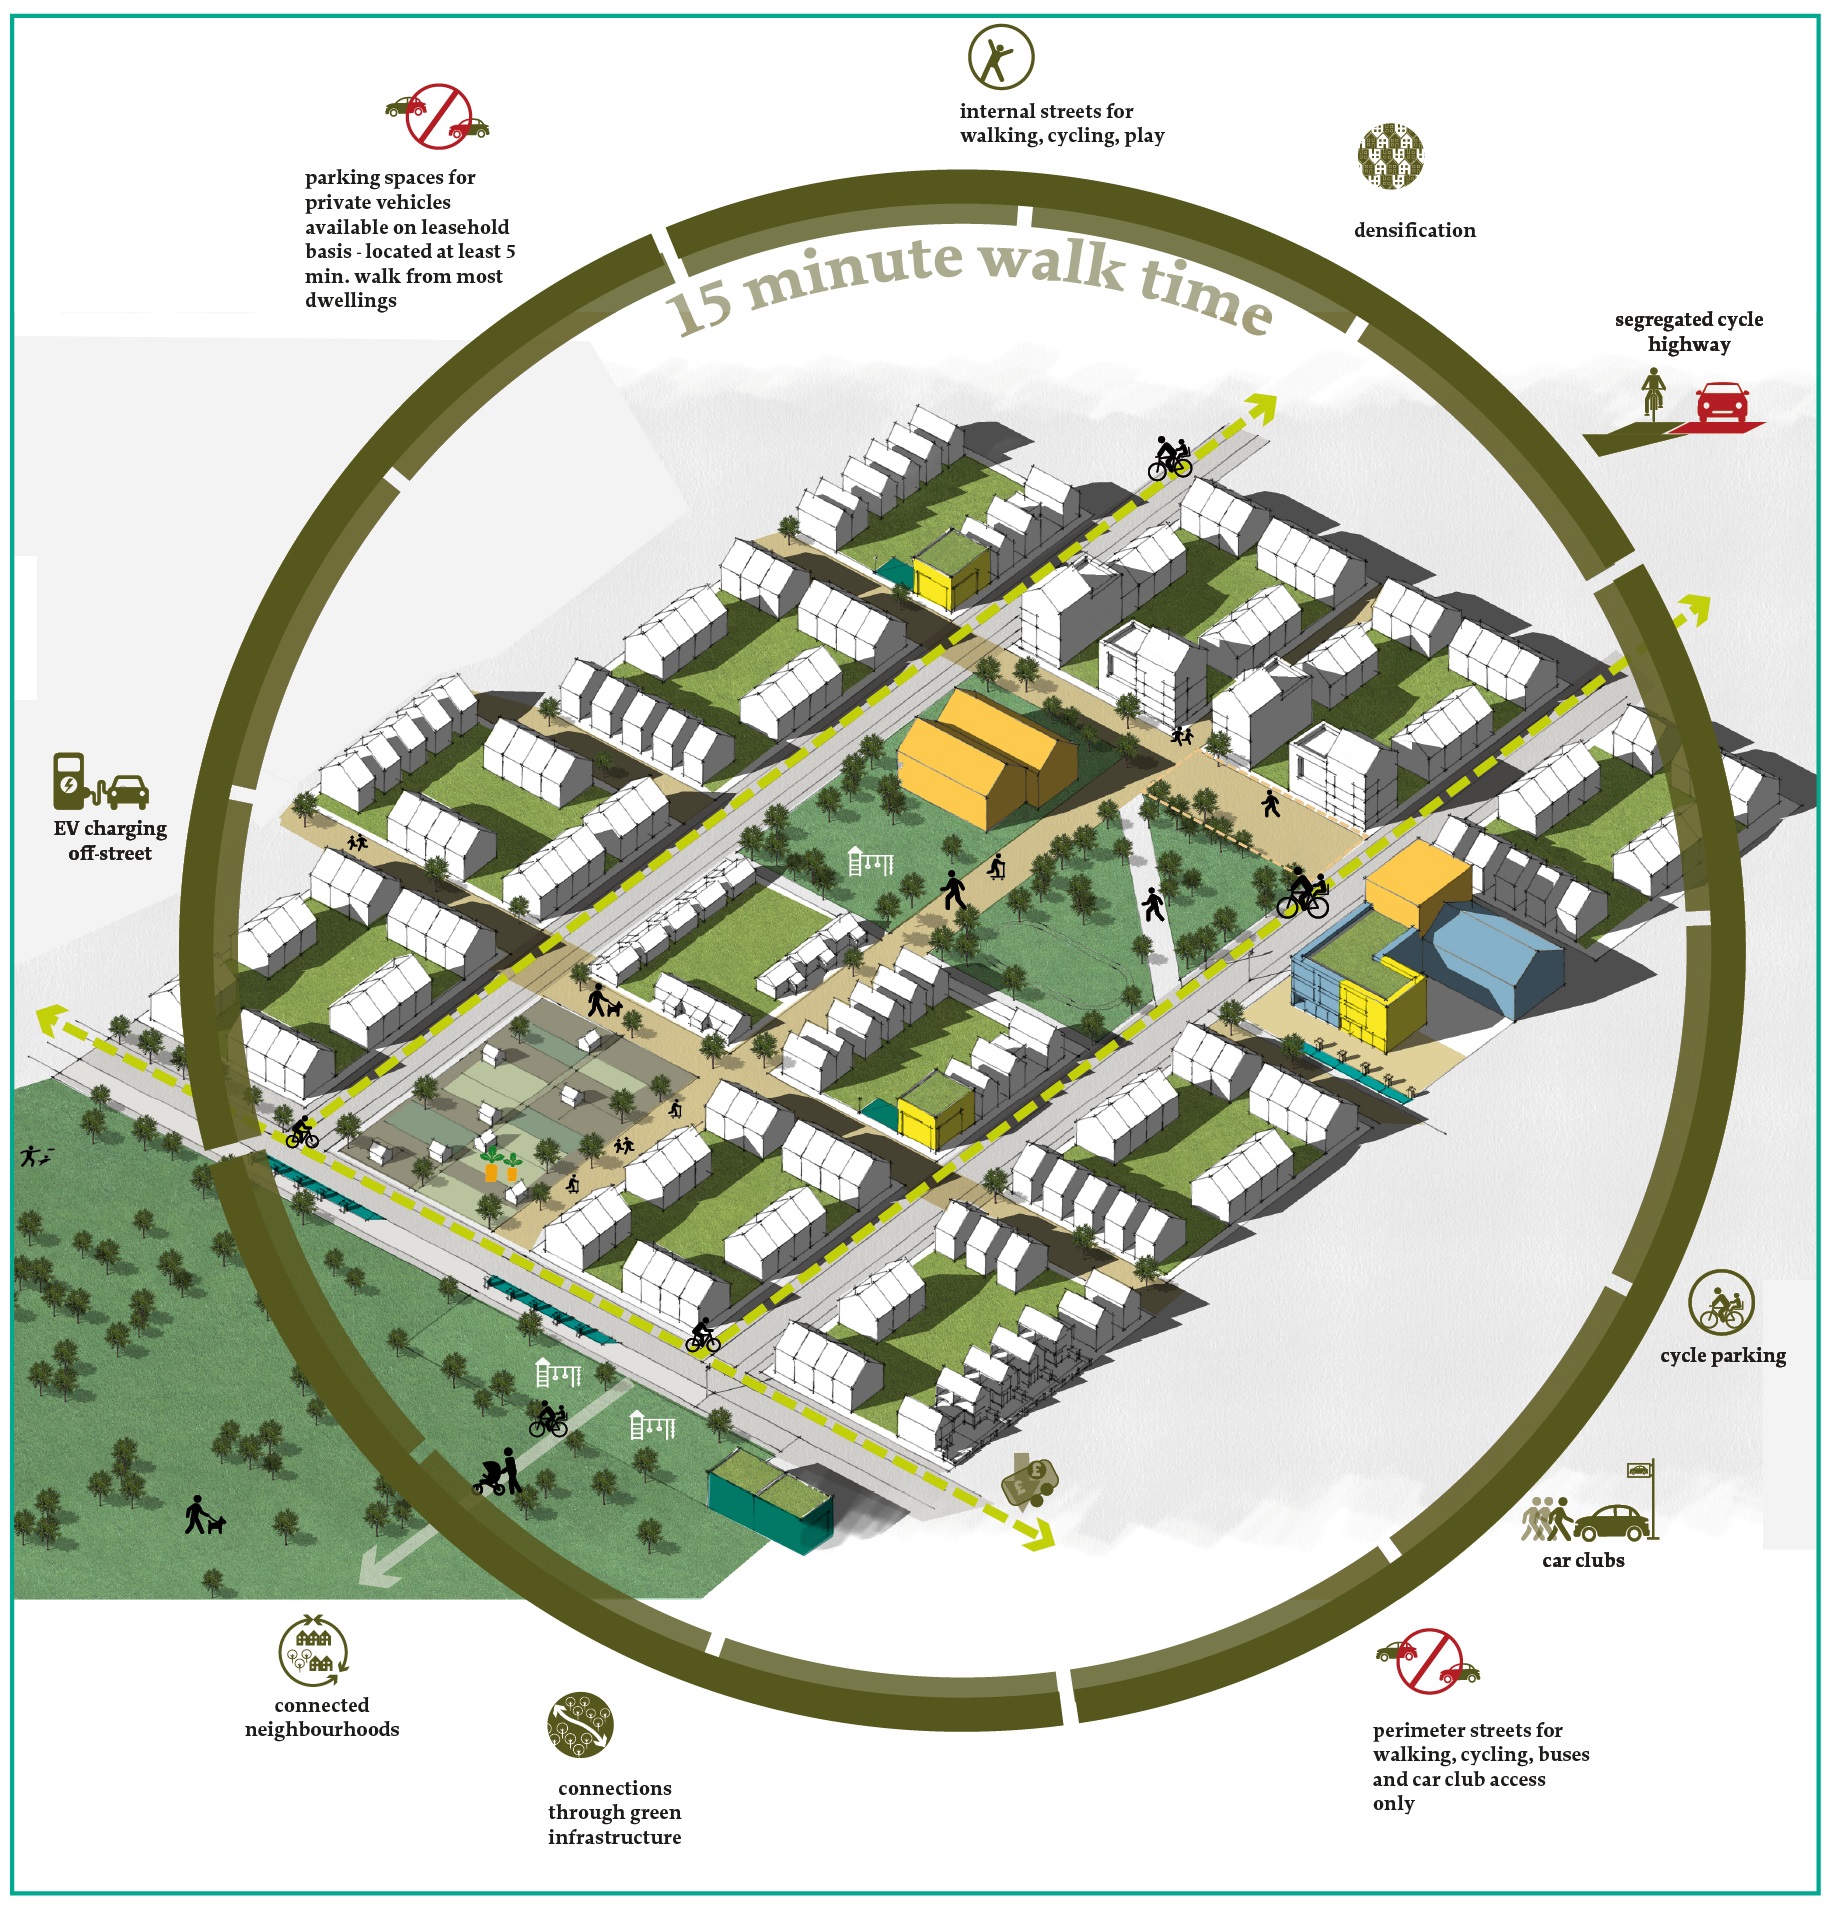
The ‘15 minute neighbourhood’ (sometimes referred to as the 15-minute city or the 20-minute neighbourhood) is one of the foundations upon which net zero transport networks can be built. The concept has become increasingly prominent since its inclusion in Melbourne’s long term planning strategy in 2018[26], and its adoption by the mayor of Paris, Anne Hidalgo, in February 2020[27].
The defining characteristic of the ‘15 minute neighbourhood’ is that people are able to ‘live local’ and meet most of their daily needs within a 15 minute walk or cycle from their home. This includes, for example, access to schools, grocery shopping and places to socialise, exercise and work. The ability to ‘live local’ in this way reduces both the number and length of journeys made on a daily basis, resulting in significant carbon savings. It also creates the conditions for healthier, happier communities.
Walking and cycling become the natural choice for short trips, facilitated and encouraged by redesigned streets and public realm that prioritises community wellbeing and the movement of people over the movement and parking of private cars. Increased levels of walking and cycling contribute to better physical outcomes[28] and improved mental health[29] while providing more opportunities to spend time in green space reduces the risk of anxiety and depression[30]. The ability to access everyday needs within the local area also contributes to the creation of more equitable and inclusive communities by removing the transport barriers to jobs and services faced by people without access to a car, and who often live far from the services upon which they rely[31].
While local living is the key tenet of the 15 minute neighbourhood, providing access to affordable, integrated public transport and new forms of shared mobility such as e-Bikes, e-Scooters and EV car clubs is also vital. This ensures that sustainable modes are a viable and attractive option for the medium and longer distance journeys that are responsible for most surface transport emissions. Higher density mixed-use development supports the viability of these transport networks, but the form, scale and appearance for 15 minute neighbourhoods can be tailored to reflect local place context and the needs and aspirations of local communities. Outside of towns, cities and built-up urban areas, this might mean taking measures to increase people’s ability to live local and use sustainable modes of transport, while being flexible on the application of a ’15 minute’ target.
In order to maximise its effectiveness, the 15 minute neighbourhood concept could be rolled-out across urban areas and their hinterlands through new development and urban renewal. A coordinated roll-out of the concept could create a connected network of neighbourhoods that scale up reductions in transport emissions and make local living, good placemaking and sustainable mobility the norm.
Figure 4.3: The neighbourhood centre (click to expand)
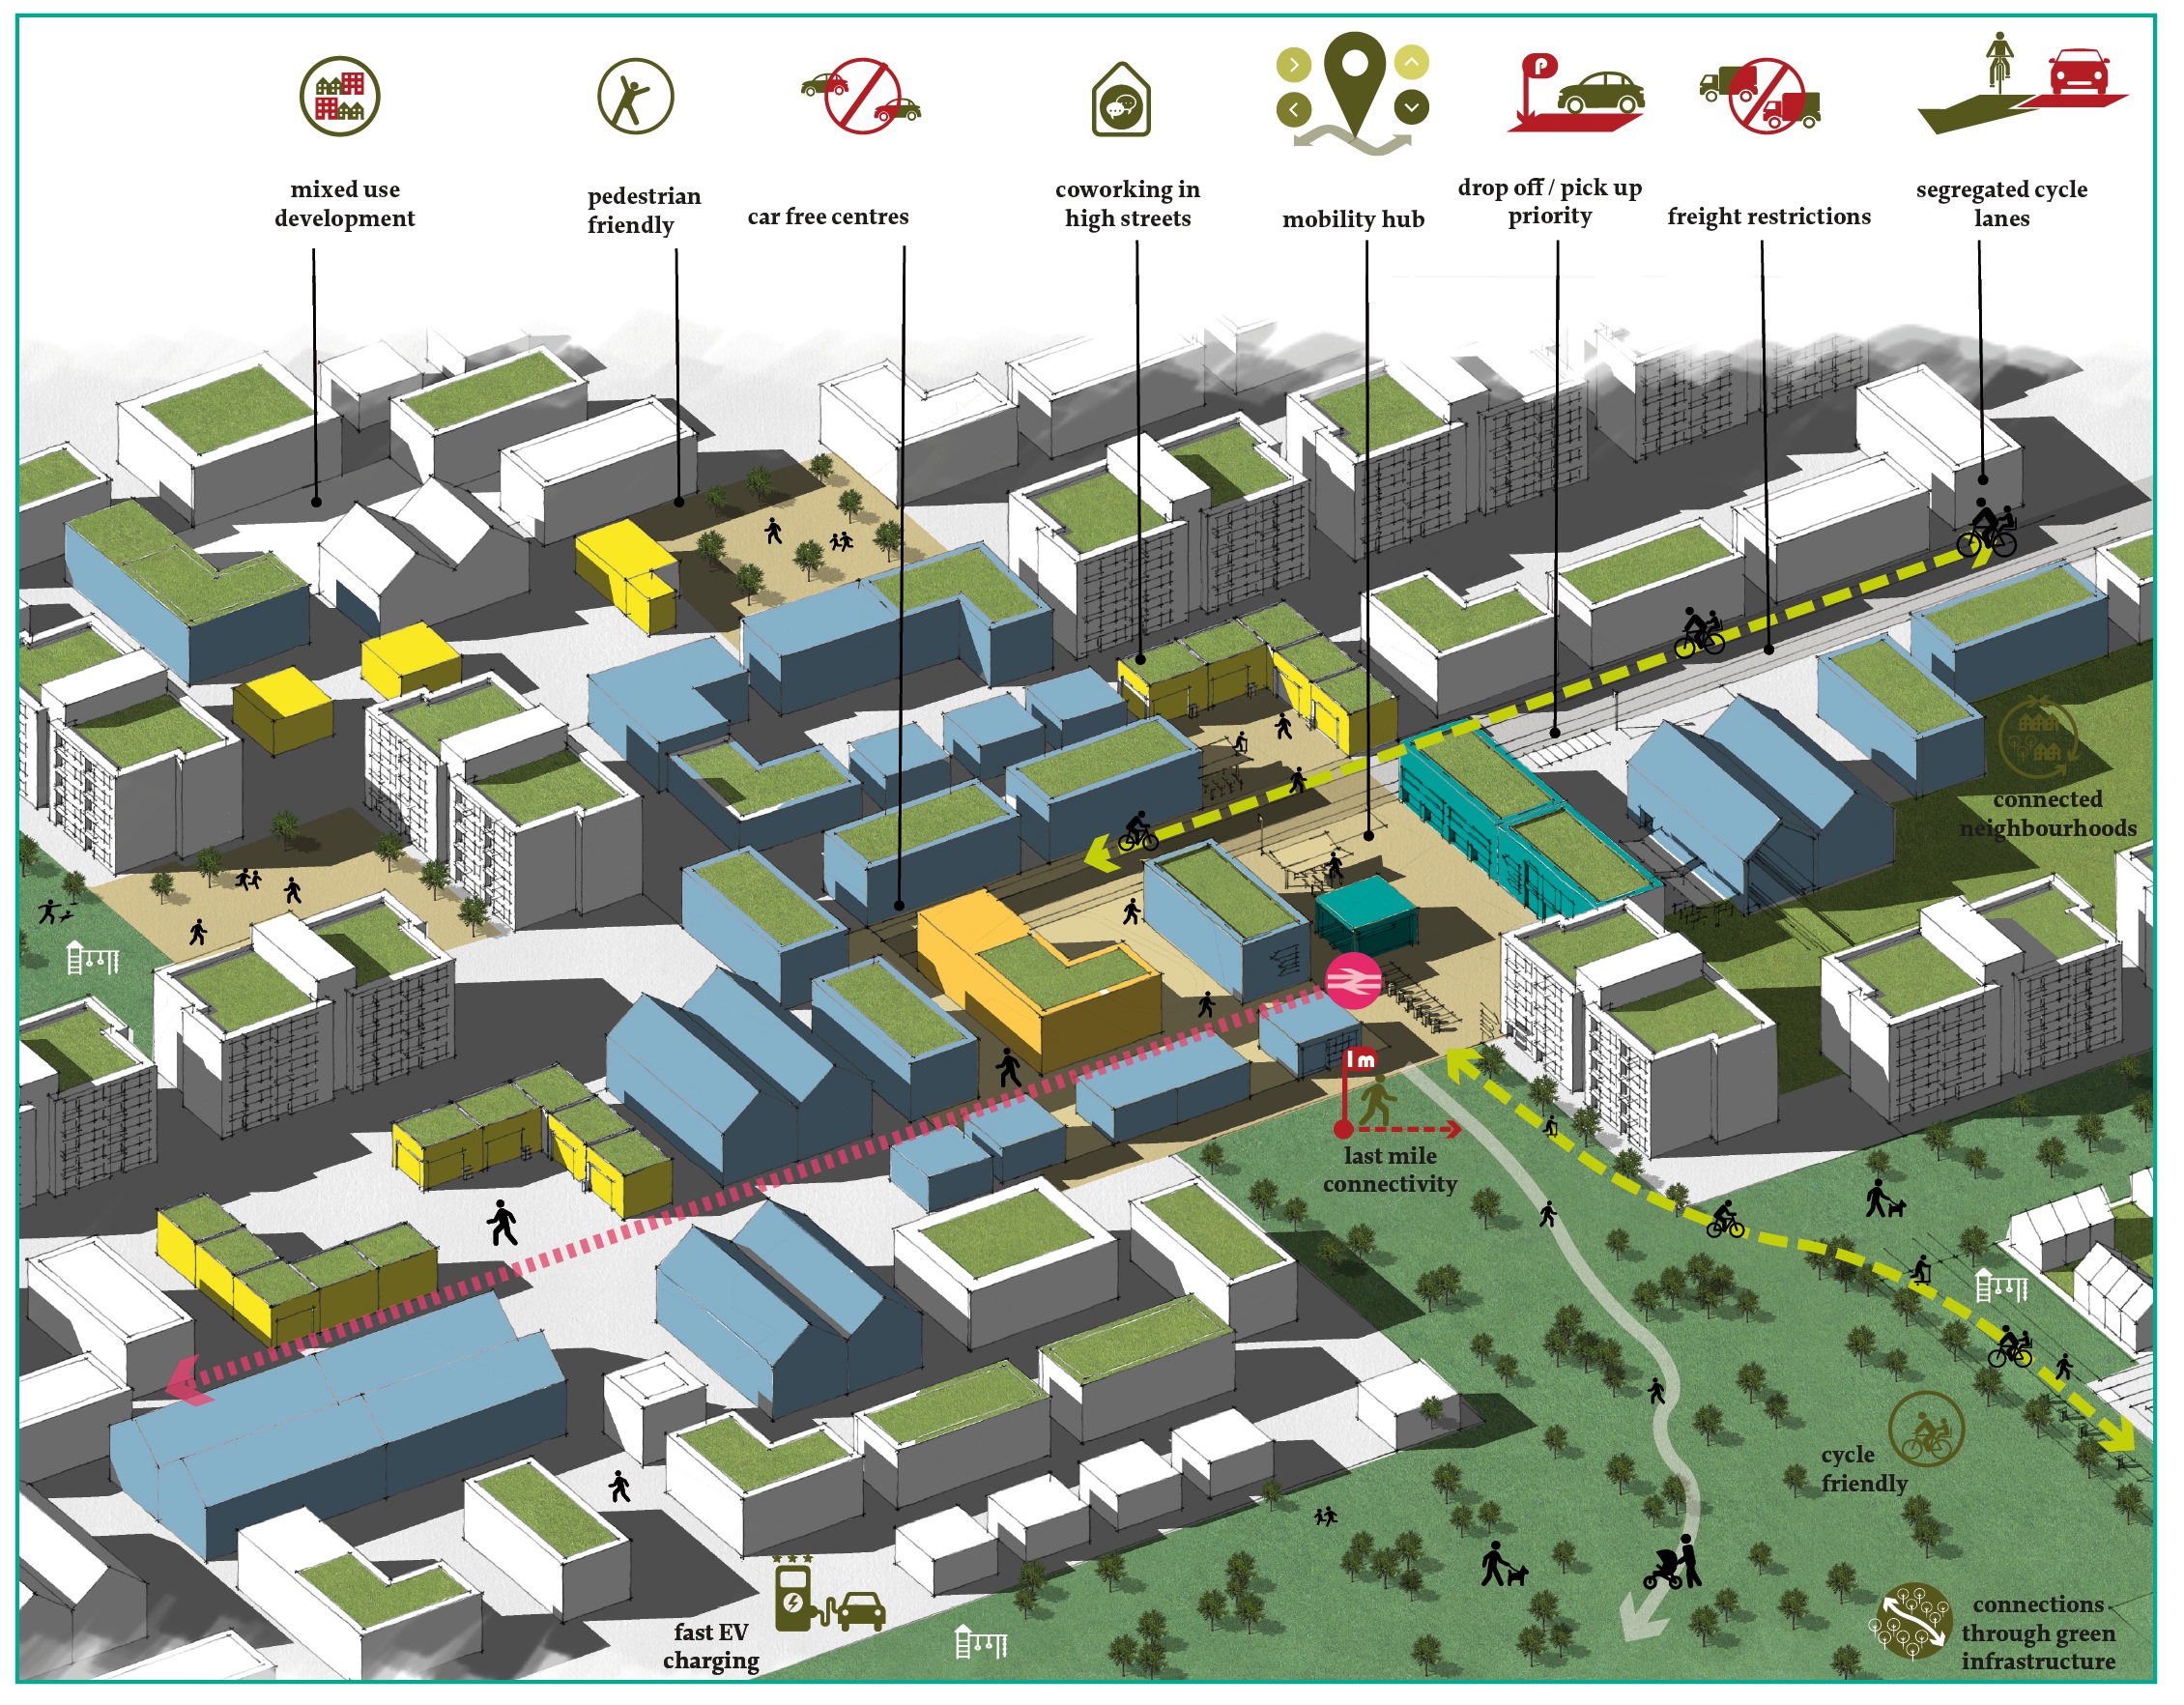
The neighbourhood centre sits at the heart of the 15 minute neighbourhood. It is the hub of community life and a focal point for the high-quality spaces, services and amenities that enable people to live local and travel less.
It accommodates higher density development combining a mix of uses including homes and space for employment and leisure to maximise its vitality and support the viability of businesses, services and public transport infrastructure.
New types of adaptable and multi-purpose spaces are key components of the neighbourhood centre, designing-in resilience to fast-paced changes in retail, public service provision and climate. Local markets, pop-up shops and flexible workspaces are not seen as ‘meanwhile uses’, but as distinctive anchors of a thriving community alongside more traditional ‘fixed’ services such as schools, health centres and pubs.
Services and facilities are tailored to the local community, minimising the need for people to travel to another area of their city or county to access the services they most rely on.
The neighbourhood centre is co-located with a mobility hub, providing excellent public transport and shared mobility connectivity as a convenient and affordable alternative to the private car.
Figure 4.4: The liveable street (click to expand)
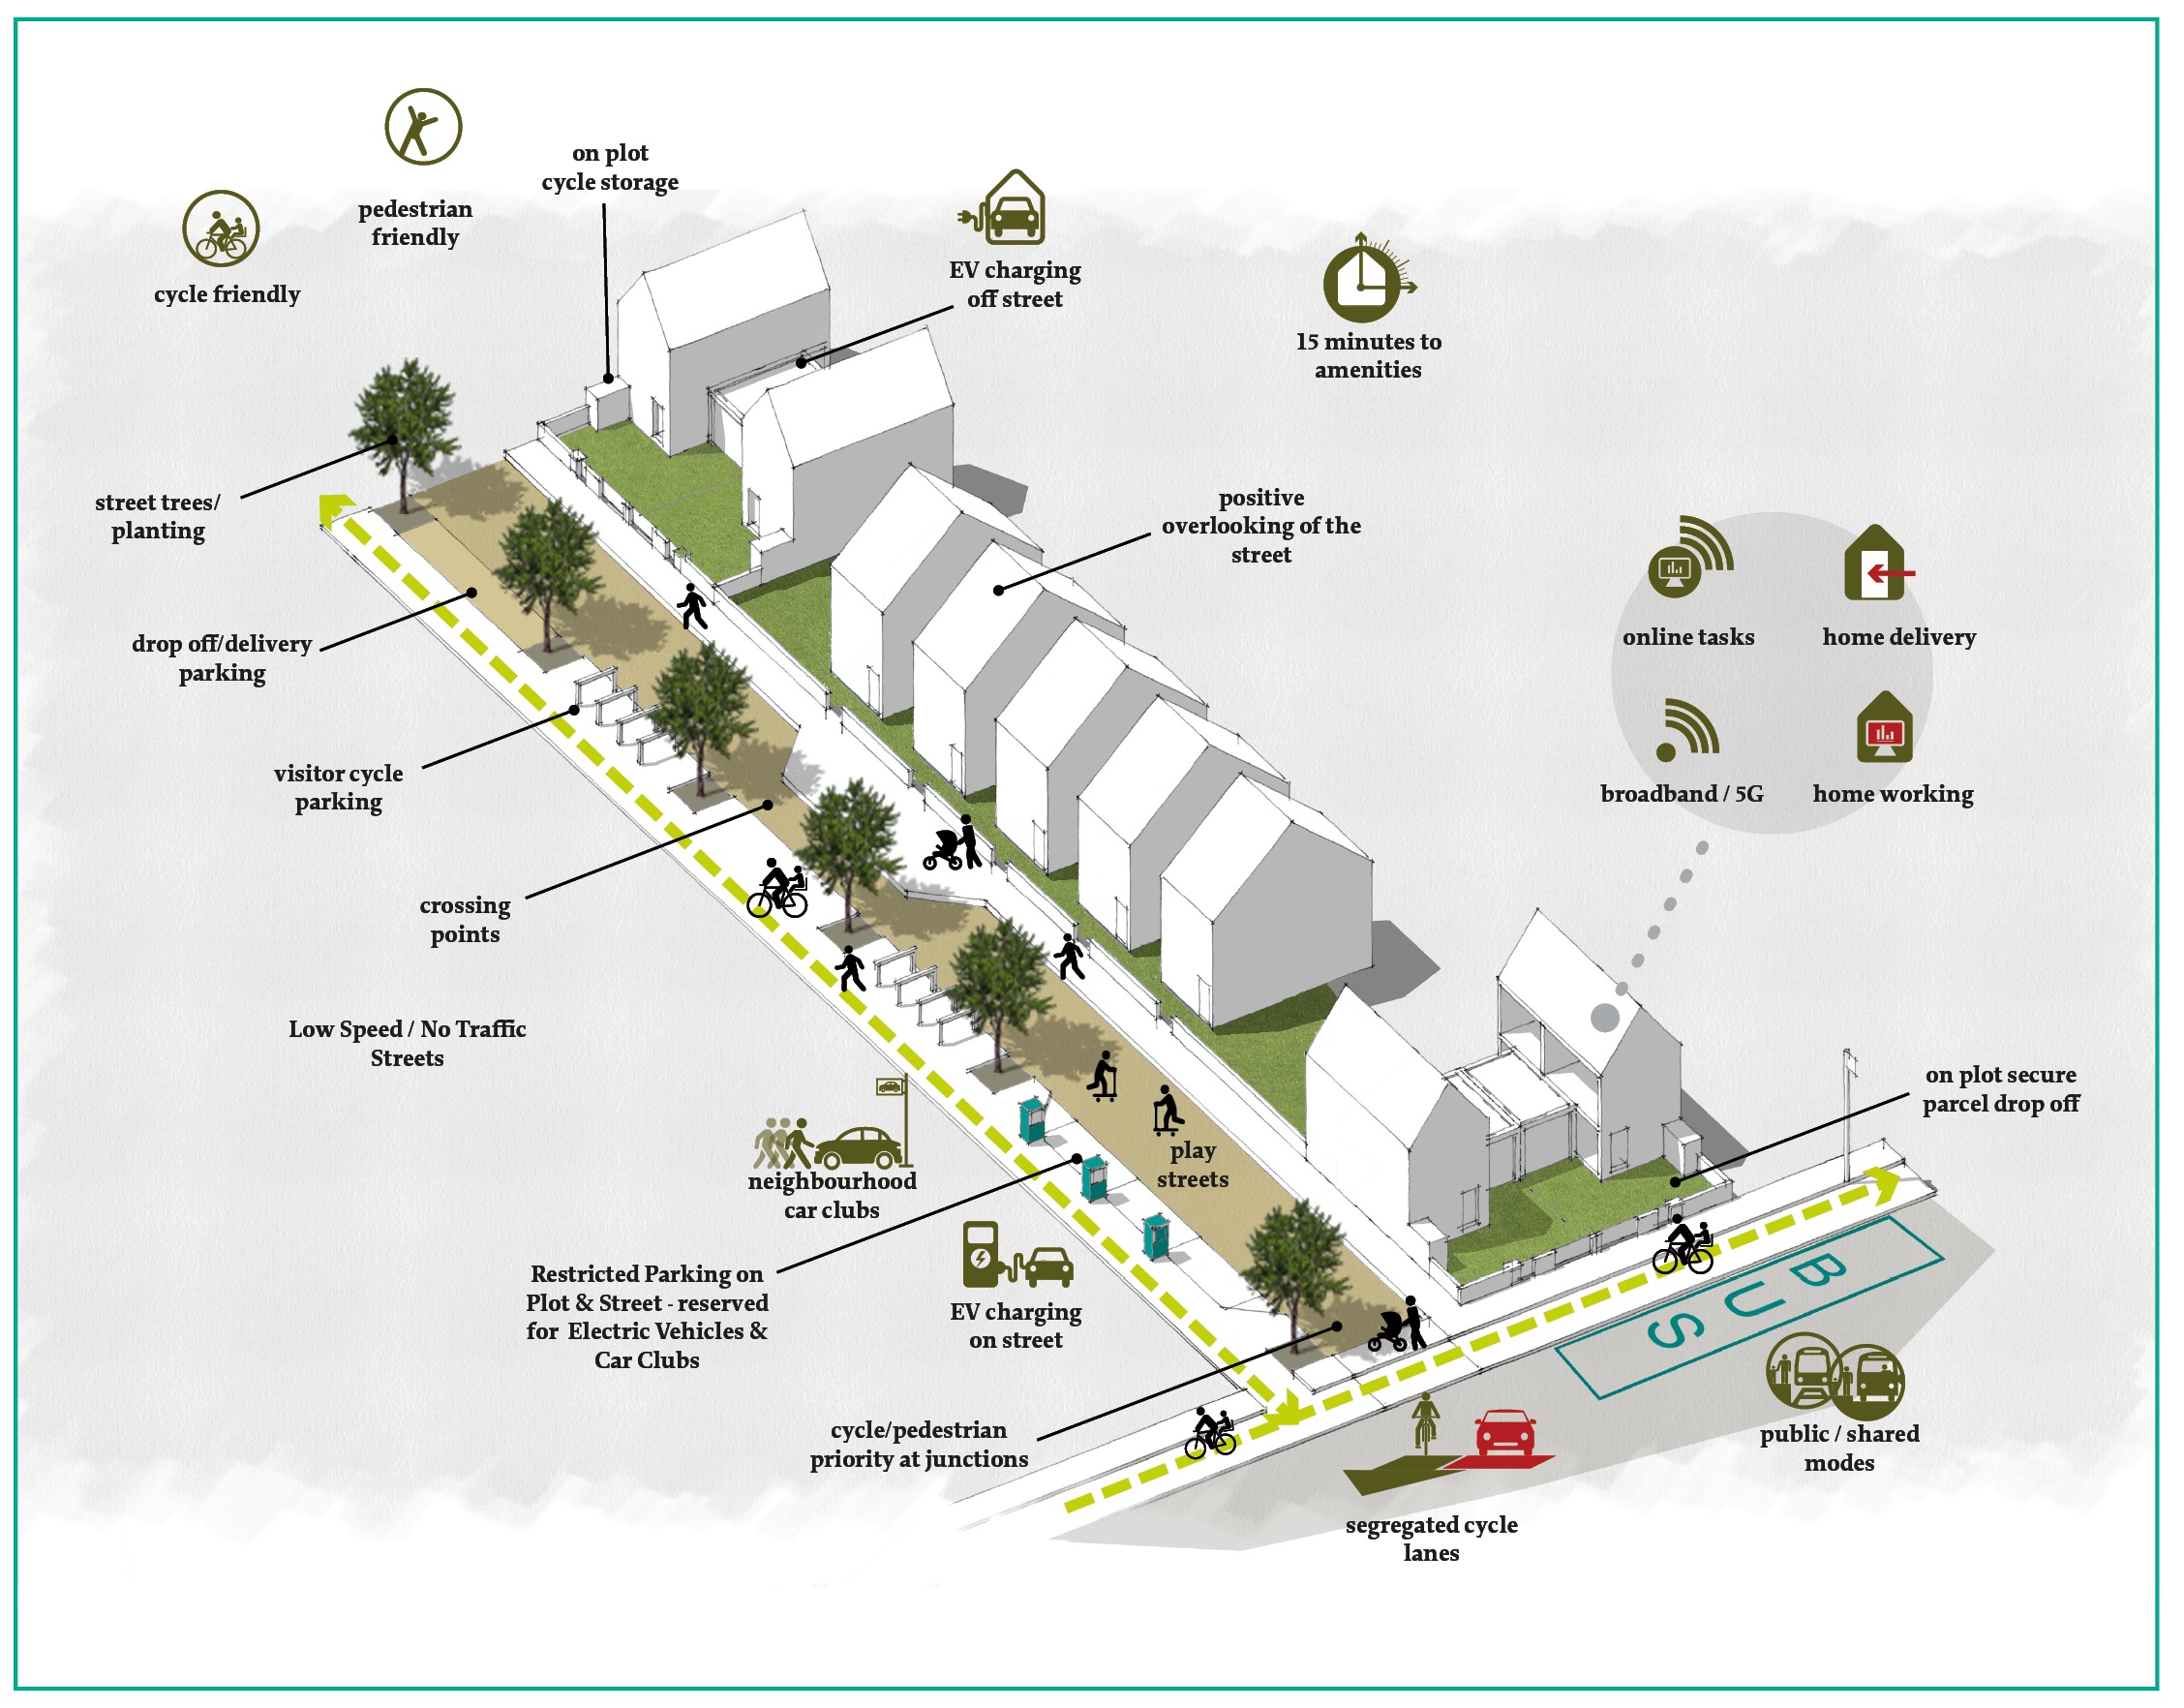
In order to maximise the uptake of walking, cycling, public and shared transport, streets are redesigned to prioritise the movement of people via sustainable modes. People of all ages and abilities feel safe and confident to walk and cycle around their neighbourhood to access local services and facilities, or to access public transport and shared mobility such as EV car clubs as part of a longer trip.
Access and parking for private vehicles and motorised freight is restricted to ensure that sustainable modes are always the most convenient and affordable option for most trips, and to create the conditions for healthier, more liveable streets.
Restricting vehicle access and removing on-street parking means children can play safely in the street. New trees, parklets and sustainable drainage features bring nature to every doorstep, with benefits to biodiversity and people’s health and wellbeing. Previously tarmacked corridors lined by cars become green, social places with space for people to come together as a community, as well as playing a vital role in facilitating sustainable mobility within and outside of the neighbourhood.
Figure 4.5: The mobility hub (click to expand)
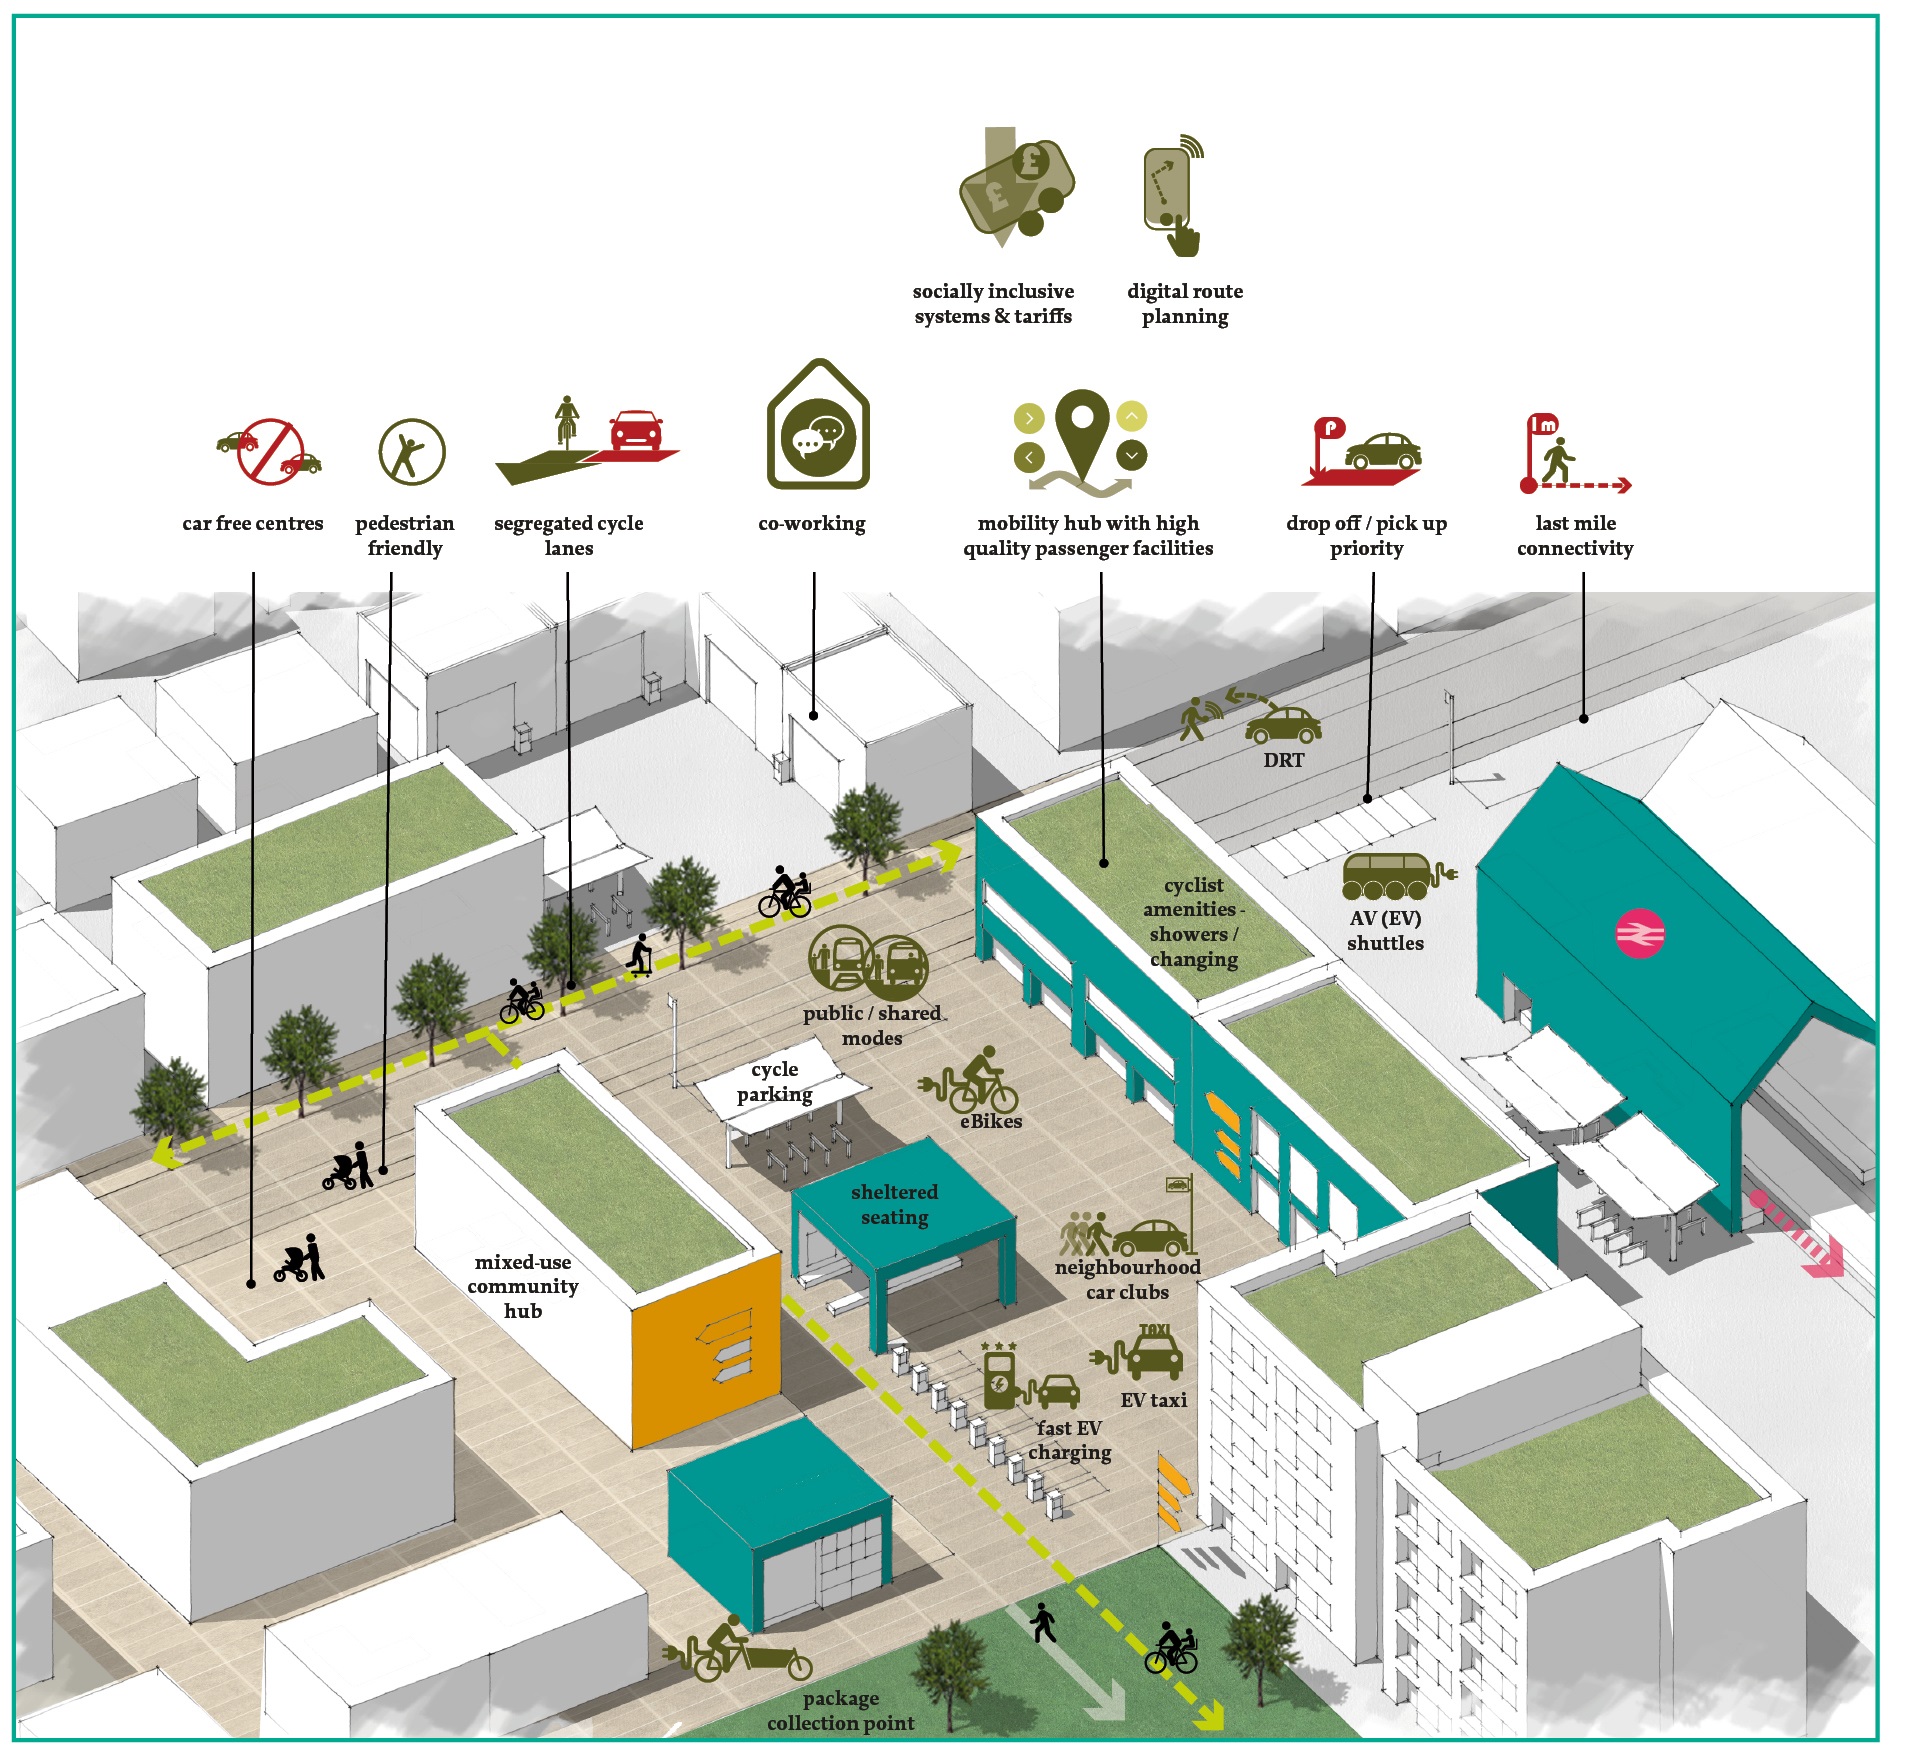
The mobility hub is the focus of trips between neighbourhoods, forming a locus around which walking, cycling, public transport and shared mobility networks converge to enable seamless movement for medium and longer distance trips.
The hub is co-located with the neighbourhood centre, driving footfall to local services and amenities. It also forms a local employment ‘destination’ for people who no longer need to commute long distances to the main office, but who value the separation of work and home-life when working remotely. Space could also be provided for ‘make spaces’ and learning to suit demand for different types of space at local level.
In additional to personal trips, the mobility hub supports the development of net zero logistics through provision of fast charge points for e-cargo bikes and EVs, integration with dedicated local logistics connections, and space for micro-consolidation to enable last-mile delivery via sustainable modes.
4.4. Leading with a vision
It is clear that the integration of transport planning with other aspects of land use planning is vital to achieve net zero. However, to maximise the potential of a more integrated planning system, we need a cultural shift from a mitigative to a creative approach.
In transport planning, this means decisively abandoning outdated assessment methodologies such as ‘predict and provide’, which lock-in and plan for continued high car dependency, and adopting new approaches such as ‘decide and provide’ and ‘vision and validate’, which prioritise the identification and delivery of more sustainable outcomes[32].
In land use planning, the shift to a creative mindset means going back to the first principles of planning, which are to plan for the benefit of the public. The application of a new model of spatial planning creates opportunities to reshape places in ways that deliver net zero transport and better placemaking - creating places which are more active, healthy, inclusive and equitable, support net gains to the environment, and provide greater resilience to economic, social and climatic changes.
The measures needed to maximise local living will strengthen the relationship between people and place. This applies to the way in which people access services, use spaces and interact with each other on a daily basis. But it also applies to the way in which communities interact with and use the built and natural environment to support local economic activity and community resilience.
For example, currently unproductive landscapes could be used to generate the electricity needed to power local net zero mobility networks, or to grow food which is supplied back to local towns and cities through net zero logistics networks.
The use of digital technology and 3D printing opens up the possibility of enabling former manufacturing heartlands to become hubs of specialised industry, creating local employment opportunities.
The repurposing of town centres and reallocation of roadspace could create the conditions for healthier lifestyles and help to tackle long-standing health inequalities, while urban renewal breathes new life into old high streets and encourages shoppers and tourists to return.
A place-based approach to decarbonisation is a catalyst for wider change and an opportunity to do things differently, and better. This process will differ according to local context, but it is vital that spatial planning – at every scale – always leads with a vision. This vision should articulate how the pathway to net zero can maximise placemaking benefits, and provide the basis of policy and funding decisions to make the most of these opportunities.
4.5. Spatial visions for the four typologies
The next section contains a vision for each of the typologies, showing how the emission reduction pathways, core spatial planning principles and building blocks could be applied to transform the place by 2030.
You can click on the vision to expand the image. Below each is a link to an information pack for each typology, which contains:
- A reminder of the typology in 2020
- The 2030 vision
- A legend to help the reader interpret where key land use and transport interventions have been made
- A short description of key changes and features
- A specific emissions reduction pathway for 2020 to 2030
- Travel data
Wotton City-Region in 2030 (click to expand)
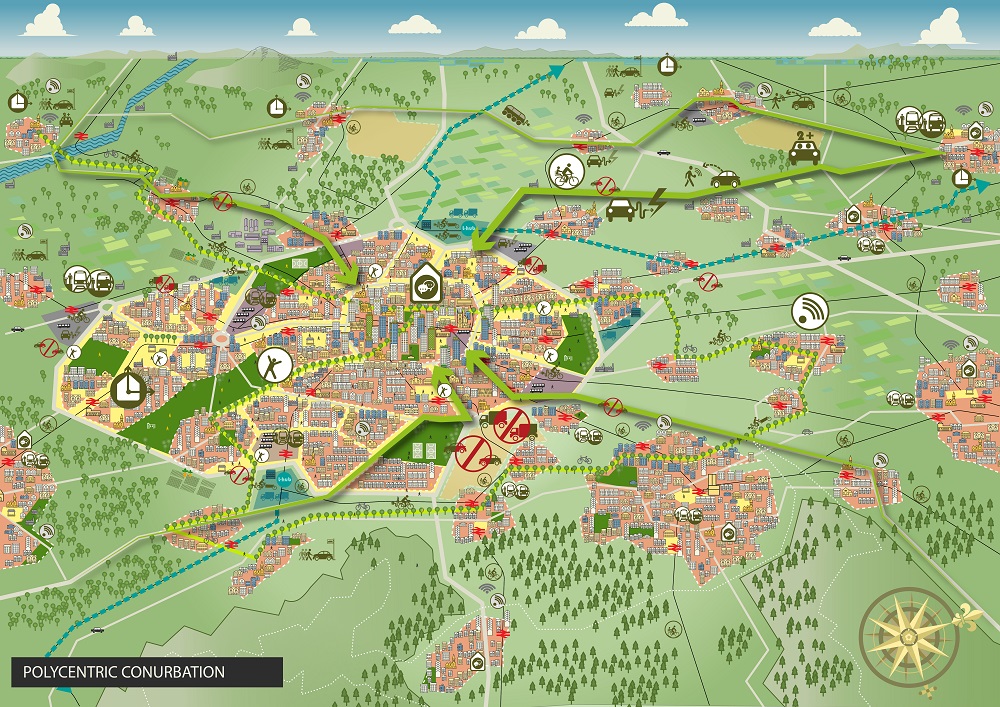
Download the information pack for the Wotton City-Region
Castlemore in 2030 (click to expand)
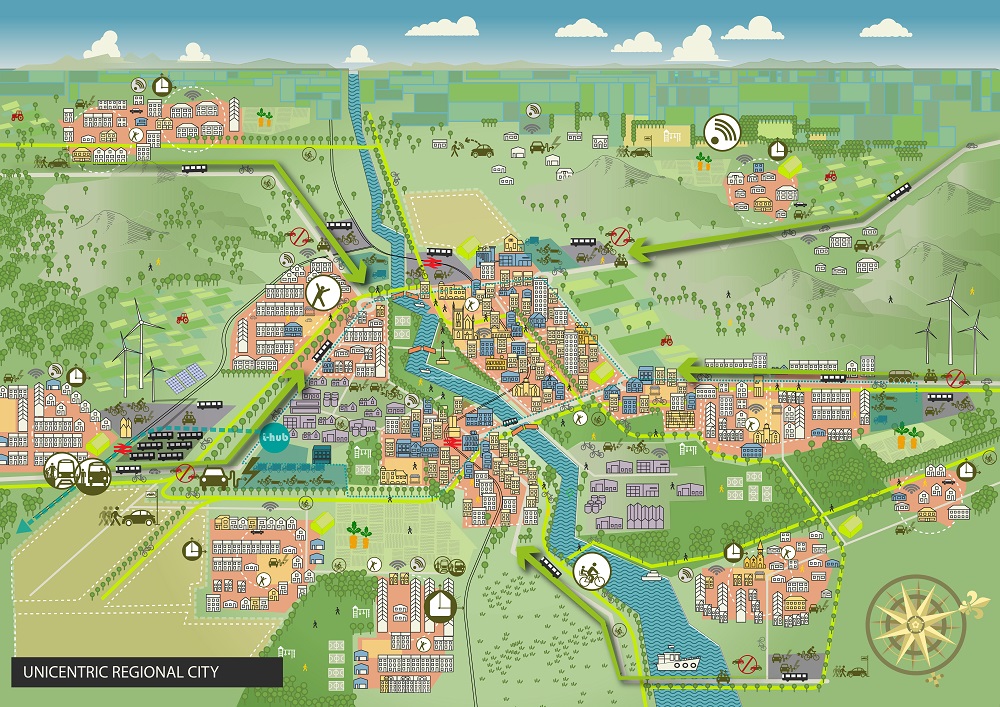
Download the information pack for Castlemore
Stoneborough in 2030 (click to expand)
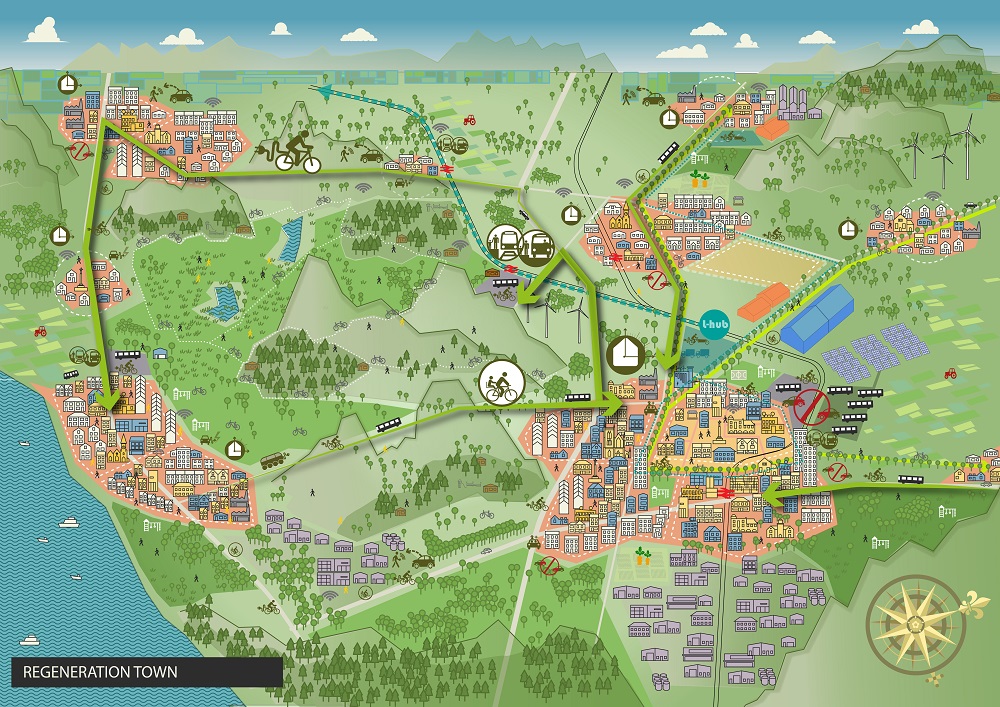
Download the information pack for Stoneborough
Ebsham and Monteshire in 2030 (click to expand)
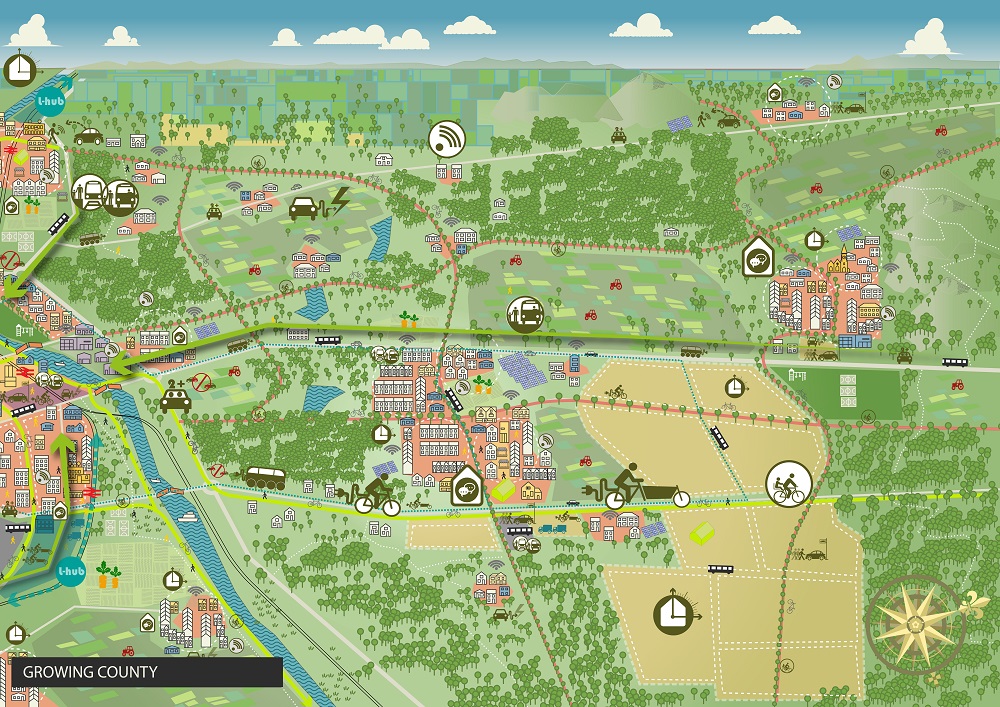
Download the information pack for Ebsham and Monteshire
5. Delivering net zero transport
This research has set out a pathway to achieving net zero transport while also delivering better place outcomes. Technological advancements will continue to make cleaner fuels and zero emissions vehicles a reality. However, it is not certain that the planning and transport systems will adapt to enable decarbonisation to catalyse better placemaking. This requires concerted action to ensure that policy and funding is aligned to support a place-based approach to decarbonisation.
It suggests the need to rethink the traditional approach to town planning, which starts with the allocation or zoning of available land for defined use. Instead, the system should put carbon reduction first, with net zero transport emissions a pre-requisite for new growth, and a priority for urban renewal and regeneration, as explained in Chapter 4.
Figure 5.1 illustrates how a ‘carbon first’ approach might be shown in a form of a simple visual Local Plan for the ‘Castlemore’ typology. This would sit alongside the place vision and more detailed masterplanning through the plan-making process.
Figure 5.1. A simplified 'zonal' plan for Castlemore (click to expand)
The need to bring the town and transport planning systems together to deliver net zero transport and better placemaking should be a central consideration in continuing discussions on planning reform in England, and a priority across the UK and Ireland.
5.1. Recommendations from the stakeholder workshops
Despite the clear benefits that result from a place-based approach to decarbonisation, this research identified major obstacles in converting the public, political and legislative will to achieve net zero transport emissions into tangible results on the ground. Many reasons were cited for this disconnect between ambition and reality during the stakeholder workshop. These include:
- A lack of effective leadership within central and local government to drive forward the net zero agenda and ensure that plans, policies and decision-making prioritise transport decarbonisation.
- Poor integration of public policy at national and local levels, in terms of aligning the transport and planning systems with achievement of net zero targets and delivery of better place outcomes.
- Difficulties for local planning and highway authorities who wish to drive net zero outcomes at the local level, stemming in part from the lack of clear national support and fragmentation of responsibilities and service delivery.
- A lack of funding and resources to invest in effective spatial planning, active travel, public transport and shared mobility, which often precludes the development and implementation of more ambitious strategies to achieve net zero transport.
- Barriers that limit the scope for significant mode shift for consumers, including inadequate sustainable transport infrastructure, the high cost of public transport and the perceived cost and accessibility advantages of car ownership for many people.
- Behavioural attachment to cars and the idea that streets and roads are primarily for the movement and storage of vehicles, which can be challenging when seeking to reprioritise road space.
5.2. Discussing next steps
Alongside this report, the RTPI has published a short discussion paper which describes these barriers in more detail, and presents recommendations from the research team and wider stakeholders for overcoming them.
Click here to download the discussion paper
References
[1] Department for Transport. 2020. Decarbonising transport: setting the challenge. Available from: www.gov.uk/government/publications/creating-the-transport-decarbonisation-plan
[2] Calculated using BEIS UK Local Authority and regional carbon dioxide emissions
[3] Department for Transport. 2020. Decarbonising transport: setting the challenge. Available from: www.gov.uk/government/publications/creating-the-transport-decarbonisation-plan
[4] Marsden, G.A. 2020. Budget 2020 – Transport: We can’t build our way out of the climate challenge’. Decarbon8 Blog. Available from: www.decarbon8.org.uk/implications-of-budget-2020-for-decarbonising-transport
[5] Committee on Climate Change. 2020. Reducing UK emissions: 2020 Progress Report to Parliament. Available from: www.theccc.org.uk/publication/reducing-uk-emissions-2020-progress-report-to-parliament
[6] Centre for Sustainable Energy. 2020. Are local plans planning for the zero-carbon future we need? Available from: www.cse.org.uk/news/view/2484
[7] Transport for New Homes. 2018. Transport for New Homes: Project Summary and Recommendations Report. Available at: www.transportfornewhomes.org.uk/the-project/transport-for-new-homes-report-2018
Transport for New Homes. 2020. Garden Villages and Garden Towns: Visions and Reality. Available from: www.transportfornewhomes.org.uk/the-project/garden-villages-and-garden-towns
[8] RTPI (2020). Plan The World We Need: The contribution of planning to a sustainable, resilient and inclusive recovery. Available from : www.rtpi.org.uk/research/2020/june/plan-the-world-we-need
[9] United Nations Climate Change. The Paris Agreement. Available from: www.unfccc.int/process-and-meetings/the-paris-agreement/the-paris-agreement
[10] HM Government. 2019. UK becomes first major economy to pass net zero emissions law. Available from: www.gov.uk/government/news/uk-becomes-first-major-economy-to-pass-net-zero-emissions-law
[11] Marsden, G.A. 2020. Decarbonising Transport: Getting Carbon Ambition Right. London: Local Government Association. Available from: www.local.gov.uk/decarbonising-transport-getting-carbon-ambition-right
[12] Committee on Climate Change. 2019. Net Zero - The UK’s contribution to stopping global warming. Available from: www.theccc.org.uk/publication/net-zero-the-uks-contribution-to-stopping-global-warming
[13] Jackson, T. 2019. Zero Carbon Sooner – the case for an early zero carbon target for the UK. Guildford: University of Surrey, CUSP Working Paper No. 18. Available from: www.cusp.ac.uk/themes/aetw/zero-carbon-sooner
[14] Office of National Statistics. 2019. Net zero and the different official measures of the UK’s greenhouse gas emissions. Available from: www.ons.gov.uk/economy/environmentalaccounts/articles/netzeroandthedifferentofficialmeasuresoftheuksgreenhousegasemissions/2019-07-24
[15] Marsden, G.A. 2020. Decarbonising Transport: Getting Carbon Ambition Right. London: Local Government Association. Available from: www.local.gov.uk/decarbonising-transport-getting-carbon-ambition-right
[16] T. Jackson (2019). ‘Zero Carbon Sooner – the case for an early zero carbon target for the UK’. Guildford: University of Surrey, CUSP Working Paper No. 18
[17]Tyndall Centre for Climate Change Research. 2019. Tyndall Carbon Targeter helps Local Authorities respond to their Climate Emergency. Available from: www.tyndall.ac.uk/news/tyndall-carbon-targeter-helps-local-authorities-respond-their-climate-emergency
[18] The Tyndall Carbon Budget Tool. Available from: www.carbonbudget.manchester.ac.uk/reports
[19] Department for Business, Energy and Industrial Strategy. 2020. Emissions of carbon dioxide for Local Authority areas. Available from: www.data.gov.uk/dataset/723c243d-2f1a-4d27-8b61-cdb93e5b10ff/emissions-of-carbon-dioxide-for-local-authority-areas
[20] Department for Transport. 2020. National Travel Survey. Available from: www.gov.uk/government/collections/national-travel-survey-statistics
[21] Barrett, M.T. 2008. Carbon Pathways Analysis: Informing Development of a Carbon Reduction Strategy for the Transport Sector
[22] ONS. 2020. Coronavirus and homeworking in the UK: April 2020. Available from: www.ons.gov.uk/employmentandlabourmarket/peopleinwork/employmentandemployeetypes/bulletins/coronavirusandhomeworkingintheuk/april2020
[23] RTPI. 2020. Plan The World We Need: The contribution of planning to a sustainable, resilient and inclusive recovery. Available from: www.rtpi.org.uk/research/2020/june/plan-the-world-we-need
[24] Chartered Institution of Highways and Transportation. 2019. Better Planning, Better Transport, Better Places. Available from: www.ciht.org.uk/knowledge-resource-centre/resources/better-planning-better-transport-better-places
[25] Ofgem. 2020. Decarbonisation programme action plan. Available from: www.ofgem.gov.uk/system/files/docs/2020/02/ofg1190_decarbonisation_action_plan_revised.pdf
[26] Victoria State Government. Plan Melbourne 2017 – 2050. Available from: www.planmelbourne.vic.gov.au/home
[27] The Guardian. 2020. Paris mayor unveils '15-minute city' plan in re-election campaign. Available from: www.theguardian.com/world/2020/feb/07/paris-mayor-unveils-15-minute-city-plan-in-re-election-campaign
[28] British Medical Journal. 2017. Cycling or walking to and from work linked to substantial health benefits. Available from: www.bmj.com/company/newsroom/cycling-or-walking-to-and-from-work-linked-to-substantial-health-benefits
[29] National Institute for Health and Care Excellence (NICE). 2014. Commuting by walking or cycling 'can boost mental wellbeing'. Available from: www.nice.org.uk/news/article/commuting-by-walking-or-cycling-can-boost-mental-wellbeing
[30] UWE Bristol Centre for Sustainable Planning and Environments. 2021. New review finds that better access to green spaces has a beneficial impact on anxiety and depression in young people, aged 14 to 24 years. Available from: www.blogs.uwe.ac.uk/sustainable-planning-and-environments/new-review-finds-that-better-access-to-green-spaces-has-a-beneficial-impact-on-anxiety-and-depression-in-young-people-aged-14-to-24-years
[31] Lucas, K., Stokes, G., Bastiaanssen, J. & Burkinshaw, J. March 2019. Inequalities in Mobility and Access in the UK Transport System, Future of Mobility: Evidence Review. Government Office for Science. Available from: www.assets.publishing.service.gov.uk/government/uploads/system/uploads/attachment_data/file/784685/future_of_mobility_access.pdf
[32] Chartered Institution of Highways and Transportation. 2019. Better Planning, Better Transport, Better Places. Available from: www.ciht.org.uk/knowledge-resource-centre/resources/better-planning-better-transport-better-places


