
State of the Profession 2023
22,000 planning professionals are working in the UK. They play an essential role in tackling the modern challenges of the 21st century, from climate change adaptation to the housing crisis. It is the RTPI's responsibility to provide a picture of what the planning profession looks like today as we navigate the landscape of the 2020s and this report does just that.
Downloads:
State of the Profession 2023
Appendix 2: Data tables and technical documentation
Report author
Gábor Csontos, Policy and Data Analyst
Contents
Headlines
Methods: data, estimates, analysis
Key results
Background and context
Purpose and aims
Structure
Scope
Research questions
Data sources
Modelling the planning profession
4 The UK planning profession in 2023
The number of planners
Membership in the RTPI
Demographics
Geography
Employment
Comparison to other built environment professions
The RTPI in international context
Education
Introduction
Resourcing planning departments
Planning system performance
Policy uncertainty
Political contestation
Salaries
Workforce shortages
References
Appendix 1: Data sources
1 Executive summary
22,000 planning professionals are working in the UK. They play an essential role in tackling the modern challenges of the 21st century, from climate change adaptation to the housing crisis. As the learned society of town planners, it is the Royal Town Planning Institute’s (RTPI) responsibility to provide a picture of what the planning profession looks like today as we navigate the landscape of the 2020s.
We took the widest possible range of available and reliable national and institutional data sources, reports and a review of current affairs to construct a robust model of the state of the planning profession in 2023. Our research reveals that, despite various challenges, the planning profession maintains its numerical stability and exhibits signs of increasing racial and ethnic diversity.
Notwithstanding these promising aspects, the issue of under-resourcing casts a considerable shadow over the planning profession and the communities it serves. This, in turn, contributes to a decline in public confidence in the efficacy of the planning system. An alarming reflection of this predicament can be seen in the real salaries of town planners, which has experienced a continuous decline over nearly two decades. Further examination of the data demonstrates a concerning trend of public sector planners dwindling in numbers, with over twenty percent of them leaving the public sector since 2010. Conversely, private sector planners have witnessed a notable upswing in numbers, almost doubling during the same period.
The result is a profession that is marked by change in 2023. While the planning profession is traditionally associated with the public sector, specifically local authorities, in 2023, the planning profession is divided into three cohorts: public sector planners working in local authority planning departments, private sector planners working for consultancies, and self-employed planners likely working as some sort of consultant. Notably, despite these shifts, the total number of planning professionals and RTPI members remains largely unaltered since the release of the RTPI's initial report on the profession in 2019.
Headlines
- We estimate that there are around 22,000 planners in the United Kingdom
- There are around 18,000 RTPI members in professional membership categories (affiliate, associate, licentiate and chartered), of whom at least 16,000 work as planners by this report’s definition. The RTPI’s coverage of the profession is therefore in the range of 74-82%.
- Most planners in the UK live in England (18,100), followed by Scotland (1,600), Wales (1,500) and Northern Ireland (800).
- About 40% of planners are women. A similar ratio holds for planners in the RTPI membership. However, there is a gender balance in the younger half of planners with RTPI membership (under the median age of 42).
- Approximately 5% of planners are people from a racialised minority. This is an increase compared to 2019. Similarly to gender, diversity in race and ethnicity is greater amongst younger professionals.
- On both national and institutional levels, there is very poor data on the representation of planners with disabilities and of sexual orientation. This hinders the self-understanding necessary for building a more equal, diverse and inclusive profession.
- Planners are increasingly employed in the private sector (50%). The largest employers of planners are local authorities and consultancies. The number of planners working in the public sector shrunk by a quarter between 2009 and 2020.
- The remuneration of planners in real terms has been in sharp decline. If salaries had followed inflation since 2005, the median planner should be making close to £50,000 annually, as opposed to the actual value of £33,000.
- There are currently around 5,200 students in 32 RTPI-accredited planning programmes, with 4,600 of them in the UK.
Methods: data, estimates, analysis
Wherever possible we aimed to rely on the most comprehensive and authoritative data sources. In practice this meant that we mostly used data from the Office for National Statistics to talk about the planning profession as a whole, and from the RTPI membership database when talking about the membership. We also included a number of auxiliary data sources, a full list of which can be found in Appendix 1.
There were cases where data quality and availability was patchy or too variable for the data to be taken directly. In these cases we prioritised headlining coherent estimates, controlled for known uncertainties, rather than exact numbers (although exact numbers and sources are also published in the supplementary documentation, in Appendix 2: Data tables and technical documentation). Lots of the numbers published in this report are thus rounded estimates or similar. We aimed to consistently signpost the certainty of our estimates and our method of arriving at them.
Key results
The number of planners is stable
Based on forecasts and the ONS Annual Population Survey data series that goes up to 2020, the United Kingdom has a stable body of planners of around 22,000. 40% of planning professionals are women and 5% are people from racialised minorities. There is evidence that diversity and representation is higher amongst younger members and students. The professional pipeline is served by a student population of 4,600 at RTPI-accredited planning programmes. The RTPI has around 18,000 members in professional membership categories (affiliate, associate, licentiate and chartered). The number of members in professional membership categories has grown since 2019. We estimate that 16,000 of them fit the ONS’s definition of town planning officer. This means that the RTPI still covers around three quarters of the planning profession[1]. There are 3,600 student members, 2,600 international members, and just under 5,000 non-planner UK members. The RTPI is present in 80 countries and territories with 2,600 international members, including 500 student members.
The remuneration of planners is declining
Based on the Annual Survey of Hours and Earnings, real salaries of town planners have been declining for nearly two decades. Adjusted for CPI inflation, the median annual salaries of a town planner was £48,476 in 2005 (expressed in 2022 pounds). In 2022 it stood at £33,946.
Up to a quarter of planners left the public sector since 2013
Since 2009, planners working in the private sector has been growing in size, while the number of planners working in the public sector have been declining. Estimates in the Annual Population Survey suggest that in the period 2013-2020 a quarter of planners could have left the public sector.
Planning is smaller than other BEPs
According to estimates based on 2020 APS data, there were fewer town planners (22,600) than architects (53,400) or chartered surveyors (61,200). The relative size of these professions has remained relatively constant since 2010. However, while only 20% of architects and 15% of chartered surveyors are women, around 40% of planners are.
There are sector-wide data gaps in EDI statistics
Societies representing BEPs should invest more in understanding how diverse and inclusive they are when it comes to categories like socioeconomic and class background, disabilities and sexual orientation, as there is currently very limited data on these. This makes comparisons between professions and measuring progress within professions difficult.
The planning system and profession faces substantial challenges
The planning system faces challenges across the UK. The cost of living and housing crises coincide with the rise of planning backlogs, the underfunding of local authority planning departments, and persistent labour shortages of planning professionals. In England, this is compounded by political uncertainty around “planning reform” on both sides of the aisle. These issues manifest as foregone construction of homes and infrastructure. Frustration with the state of the planning system also results in personal attacks on professionals in public and social media.
2 Introduction
Background and context
Two decades into the 21st century, societies around the world face enormous challenges – climate change, pandemics, changing patterns of work, biodiversity collapse, infrastructure planning – that in one way or another have implications for the built environment . In the United Kingdom, national planning systems are intended as tools to sustainably mediate between the state, civil society and the built environment sector as they tackle these challenges. Running an effective and efficient planning system requires a healthy, diverse and vibrant planning profession.
The RTPI is the sole chartered professional organisation of planners in the UK[2]. It represents the perspective and interests of the planning profession towards policymakers and the public. As a learned society, it also aims to foster self-understanding and both theoretical and practical discourse within the profession. This updated report on the state of the planning profession forms a key element in the RTPI’s 2022-24 Research Strategy[3].
The present report builds on the results of the previous paper The Planning Profession in 2019[4]. It seeks to synthesise the best available data sources on the planning profession into an up-to-date and coherent picture of the number of planners, their demographic breakdown and their geographic distribution. It contextualises these findings by comparing planning to other built environment professions, current and future demands on the profession and our current capacities to meet them.
Purpose and aims
The purpose of this document is to provide an up-to-date, rigorous overview of the available evidence on the state of the UK planning profession (in the four nations of England, Scotland, Wales and Northern Ireland). This includes demography, geography, employment relations, comparison to other built environment professions, education of future planners, and the size and international context of the RTPI as chartered membership organisation. Similarly to the previous publication in 2019, it aims to be a reference document for the RTPI, for practitioners, researchers, the media, and the public when referencing and understanding the size and composition of the planning profession. It seeks to achieve this by collecting and synthesising the best available national and institutional data sources on its objects, while presenting this process through a transparent discussion of methodology and limitations.
Structure
The rest of the report is divided into three main sections.
Section 3 – Methodology defines the scope and research questions underlying the report and discusses the data used and our approach to making up-to-date estimates.
Section 4 – The profession provides a demographic, geographic and economic analysis of the UK planning profession, with special attention to its relation to the RTPI.
Section 5 – Current challenges puts these numbers in perspective by surveying current challenges facing the UK’s planning systems within which planners work.
Following the main sections, Section 6 identifies objectives for further research and concludes.
3 Methodology
Scope
The subject of this research is the UK planning profession taken as a whole. To operationalise this concept, we had to find a working definition of who constitutes a ‘planner’. Our definition needed to fit two constraints: 1) be commensurate with the main available data sources and 2) enable continuity with the 2019 report[5]. To fulfil these criteria, we kept the 2019 report’s definition.
We focus on those individuals who the Office for National Statistics (ONS)’s 2010 occupational classification
system identified as Town Planning Officers (2432).
The benefit of this definition was the availability of national data. However, there were concerns that this definition could explore part of the wider planning profession, such as students, academics and some enforcement planners, who the ONS used to partly classify under a different occupational code (3121 – Architectural and town planning technicians). Due to difficulties separating architectural roles form planning-related roles amongst this latter category, and having weighed methodological costs and benefits, we decided to focus on 2432 – Town Planning Officers[6].
In the technical documentation to their Occupational Coding Tool, the ONS lists the following job titles as corresponding to the 2432 – Town Planning Officers group: [7]
- County planning adviser
- Town planning consultant
- Urban designer
- Development control officer
- Local government planning officer: building and contracting
- Enforcement planner
- Town planner
- Town and country planner
- Planner, town planning
Another issue is the accuracy of the job data in the RTPI’s membership database. Members can voluntarily update their job titles, but it is likely that not all of them do so every time they change employment. This can lead to errors in their classification.
When discussing the RTPI membership, we sought to limit ourselves to those who would most likely fall under the ONS category of Town Planning Officer.[8] For this we filtered our membership by a combination of membership status and a classification of job titles. The filtering rests on the assumption that member job titles are mostly up to date and a good indication of whether the given member works as a town planner. Therefore, the data points based on this filtering should be treated as estimates.
Research questions
Having defined the UK planning profession for the purposes of this report, we identified the following research questions:
- The state of the profession
- What is the total size of the UK planning profession in 2023?
- What percentage of the profession does the RTPI cover?
- What is the demographic breakdown of the profession by gender, race and ethnicity and age group?
- What is the geographic distribution of the profession by country and region?
- Putting the profession in context
- How does the planning profession compare to other BEPs in terms of size and diversity?
- How does the UK planning profession measure up to the demands of the future by educating the next generation of planners?
- How does the UK planning profession hold up in the face of challenges to the planning system?
Data sources
A wide variety of data sources were used in the assembly of this document, including data from the Office for National Statistics, RTPI-held membership data and data building on findings from other publications. A detailed description of these can be found in Appendix 1: Data sources.
The key data challenge to address was a set of data quality issues in the Annual Population Survey (APS) data, which was connected to the switch from the SOC2010 to the SOC2020 occupational classification. Taking these into consideration, and after consultation with ONS staff, we decided to exclude the most recent years of data (2021-22) and use alternative methods as a temporary solution to estimate values for 2023. 2021 and 2022 were also years heavily affected by the COVID-19 pandemic, which further added to the uncertainty. For a more detailed description of these issues please refer to Appendices 1 and 2.
Modelling the planning profession
The best way to think about our method is that we aimed to create a comprehensive “model” of the planning profession in 2023. In this context this means tables of labelled values (such as size of the profession, RTPI membership, number of planning schools etc) which we sought to populate with the best estimate for each value.
This involved a three-stage process. First, we collected all available data. Second, we formulated a list of values to be estimated for 2023. Third, we used the best available method to arrive at reasonable estimates for these values based on the available data.
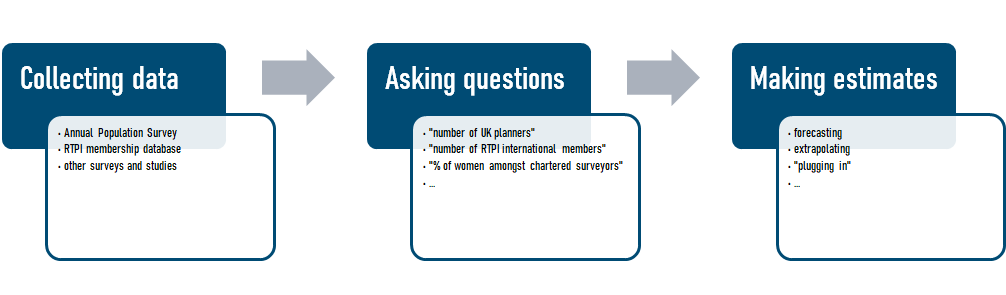
Figure 1
When recent data was available, we could simply include this in the model. More often, however, data was dated or came from a variety of years and sources. We therefore had to rely on a set of extrapolation and estimation methods to provide our most confident estimates for the present moment. Details of these methods can be found in Appendix 2: Data tables and technical documentation. Once the model of the profession was available, we could treat it as a basis of comparison and analysis when it came to discussing BEPs, international counterparts and future challenges.
4 The UK planning profession in 2023
The number of planners
We estimate that the number of Planners in the United Kingdom remains around 22,000 in 2023.
We arrived at this number by extrapolating from ONS-published data from the Annual Population Survey and heuristically adjusting for uncertainty. In lieu of adequate ONS estimates for 2021-2023, to estimate the size of the profession at the present we relied on statistical forecasting (exponential smoothing). While these results must be treated with caution, compounded with qualitative analyses and other empirical data they are a reliable starting point. While the 95% confidence interval of the model is quite wide (suggesting between 20,160 and 23,712 planners, with a rounded estimate of 21,900), there is no evidence, quantitative or qualitative, of dramatic swings in either direction since the previous report.
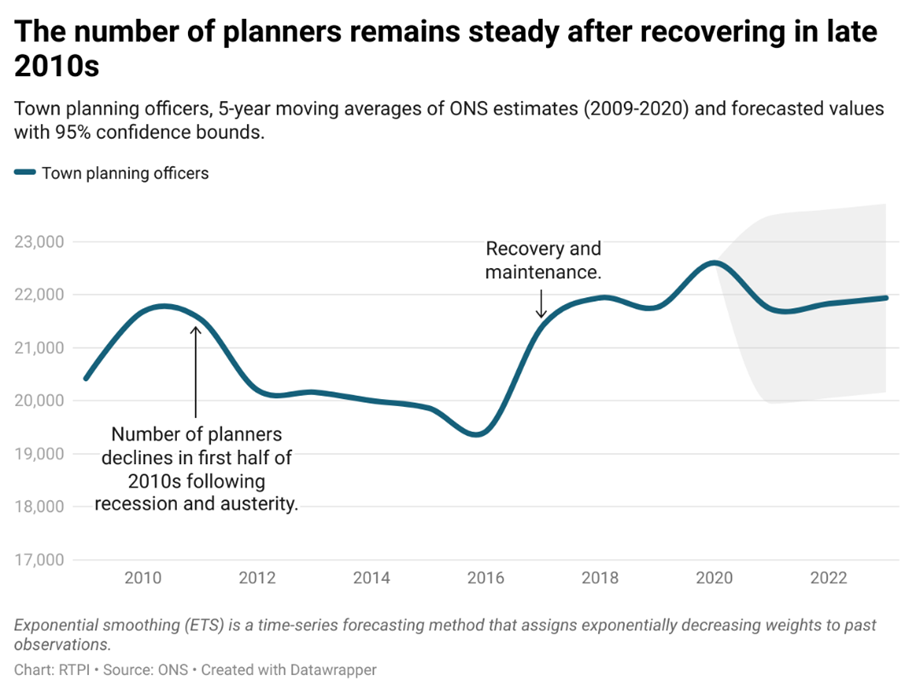
Figure 2
In the RTPI’s Planning Profession in 2019 report we noted the dip in APS estimates in 2011-2012 and subsequent rise in 2017-18. We hypothesised that the dip is explainable by conditions in the aftermath of the 2008 recession and the subsequent period of austerity, which affected public sector funding. The analysis of the annual number of new RTPI members corroborated this scenario, with the number of new joiners dwindling after 2010 and slowly recovering since (this is true even if we discount the increase in free student memberships, which have been extended through RTPI policy since 2014).
Evidence shows that planner numbers were persistently low in the first half of the 2010s, hovering around 20,000. Since their recovery in 2017 they remained relatively stationary at around the 22,000 level. Based on the 5-year moving average of APS estimates, there were likely around 22,600 planners in the UK in 2020, and their number remains around 22,000 in 2023. In the rest of the report, and in estimating geographic and demographic breakdowns, we take the estimate of 22,000 planners as our starting point.
Membership in the RTPI
Around three-quarters of UK planners are RTPI members. The RTPI has over 27,000 active members. We estimate that a little less than 25,000 of them are active in the UK. 18,400 of them are in the Affiliate, Associate, Licentiate, Chartered or Fellow membership classes (the main ones outside these being Retired and Student). Of them, based on job title data, we estimate that 16,000 would fit the town planner definition used in this report.
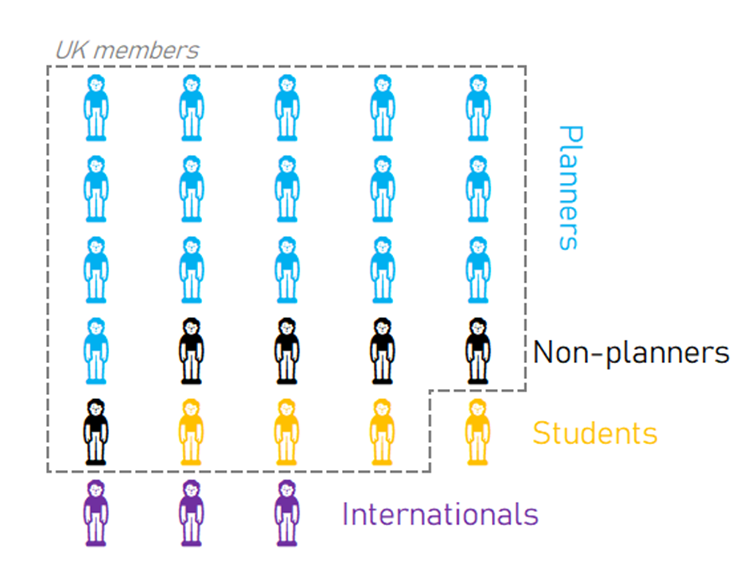
Figure 3 | Approximate breakdown of the RTPI membership. 🧍= ~1000 members
These numbers are relatively unchanged since 2019. In The Planning Profession in 2019 we reported that around 74% of town planning officers were members of their professional organisation. While the number of members grew in these membership categories, with an estimate of 16,000 members who work as Town Planning Officers, the RTPI continues to cover around three quarters of the profession. If we just take the numbers in professional membership classes for granted, this number might be over 80%. This suggests that the RTPI retained its market share but still has space for growth in the remaining quarter of the profession. Analysis of age group data shows that it is likely that the coverage of RTPI membership is lower amongst younger planners, suggesting that efforts could be made to reach these age groups.
Demographics
This section considers the demographic breakdown of the UK planning profession based on available national statistics, chiefly the Annual Population Survey. These cover gender, age, race and ethnicity and nationality. There is insufficient data on either the national or RTPI membership level about socioeconomic background, disability and sexual orientation.
Gender
We estimate that in 2023 around 40% of planners were women. This is unchanged since 2019. The overall RTPI membership has a similar proportion of women (41%). However, this is heavily influenced by age. If divided into two halves at the median age of 42, the younger half of the membership working as town planning officers are at gender parity, while the elder half is almost two-thirds men. Further research should be carried out to see how this breakdown interacts with the professional life-paths of women, (e.g. struggling to find employment following maternity leave).
Age
Estimates on the age distribution of planners based on averaging APS data 2016-2020 shows that the largest 5-year cohort is those between 40 and 44 years old, with over 5,000 planners. Notably, the overall distribution deviates from normal distribution: there is a “dip” at the 30-34 year-old cohort (both the younger and older one contain more members). This suggests planners either leaving the profession or starting at lower rates than earlier and later age groups. Amongst RTPI members working as town planners, the median age is 42.
Race and ethnicity
In evaluating the diversity and inclusivity of the profession, we are primarily concerned with quantitative disparities between various groups affected by racism. The way national and institutional statistics define and classify racial and ethnic categories is often unsatisfactory. While it is crucial to recognise that race and ethnicity are not the same, the social construction of race is often mediated by ethnicity. In the current situation, we are in general reliant on using statistics of ethnicity as a proxy to get at the social issue we want to address: the representation of racialised minorities in a subset of society (the planning profession), in comparison to the totality of society.
The planning profession is less diverse in terms of race and ethnicity than the overall population, but there are signs that this is improving. Based on the 5-year average of APS estimates (2016-2020), 95% of Town Planning Officers belong to a White ethnic group, and 5% to a racialised ethnicity. Because of small sample sizes, more detailed breakdowns are not currently possible on the basis of this data.
This is a lower ratio of individuals from a racialised minority compared to the general population (which is 81% White and 19% racialised minorities according to the 2021 census[9].) However, it is 1-2 percentage points higher than our estimate in 2019, which was 3-4%, suggesting a moderate improvement.
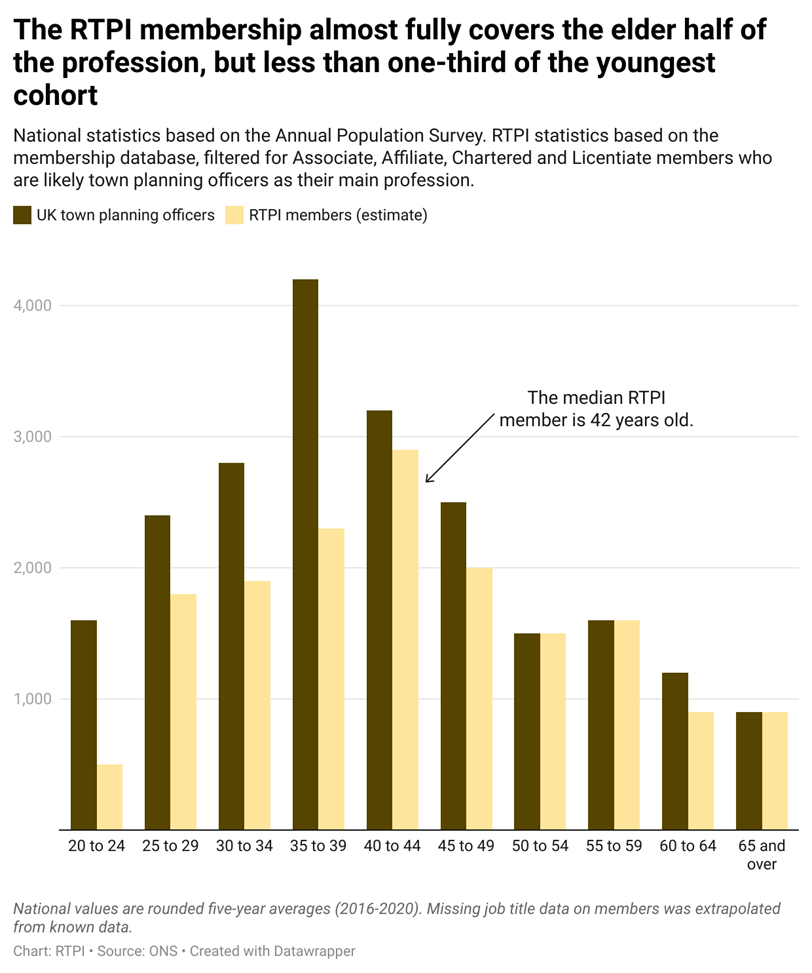
Figure 4
Nationality
Data on the nationality of planners is sparse. Town Planning Officers are on the list of professions eligible for a Skilled Worker Visa application, and the RTPI recently explored the option of using immigration to fill in some skills shortages in local authorities. However, at present, this does not seem to be a well-established route.
In the 5-year period 2014-2018[10] the average APS estimate is that 94% of the planners identified with a UK nationality, 4% with an EU nationality and 2% with other nationalities. According to the 2021 Census, 90.3% of the total population in England and Wales “identified with at least one UK nationality (English, Welsh, Scottish, Northern Irish, British and Cornish)”[11],[12].
We can tentatively say that people who do not identify with a UK nationality are slightly underrepresented in planning compared to the general population. The professional skills and body of knowledge of UK planning system required to work in the profession may be a barrier for entry for international professionals.
Limitations of EDI data
There is a marked lack of data on both nationally and institutionally on disability and sexual orientation. To build a more equitable, diverse and inclusive profession, it is important going forward that data collection on the representation of these groups of people improves. In the absence of this, it is a challenge to make any well-founded claims on inclusivity relating to disability and LGBTQ+ communities within the planning profession.
Geography
We estimate that in 2023 there were 800 planners in Northern Ireland, 1600 in Scotland, 1500 in Wales and 18,100 in England. These estimates are a composite of APS estimates, forecasts and research carried out by RTPI Scotland [13].
Due to small sample sizes, there is a lack of robust data on the regional level. Based on the 2016-2020 APS series for English regions, the regional distribution of planners largely follows the distribution of the general population.
It seems that the distribution of RTPI members is also similar, with the notable exception of the West Midlands, where only an estimated 58% of town planning officers are RTPI members[14].
Employment
Traditionally, planning is a profession associated with the public sector, specifically local authorities. This image of the planner, working in development management, enforcement or policy-making has recently been complicated by the precipitous rise of the private sector (including of independent consultancy) in planning. By 2023, the planning profession can be broadly divided into three cohorts: public sector planners working in local authority planning departments, private sector planners working for consultancies, and self-employed planners likely working as some sort of consultants.
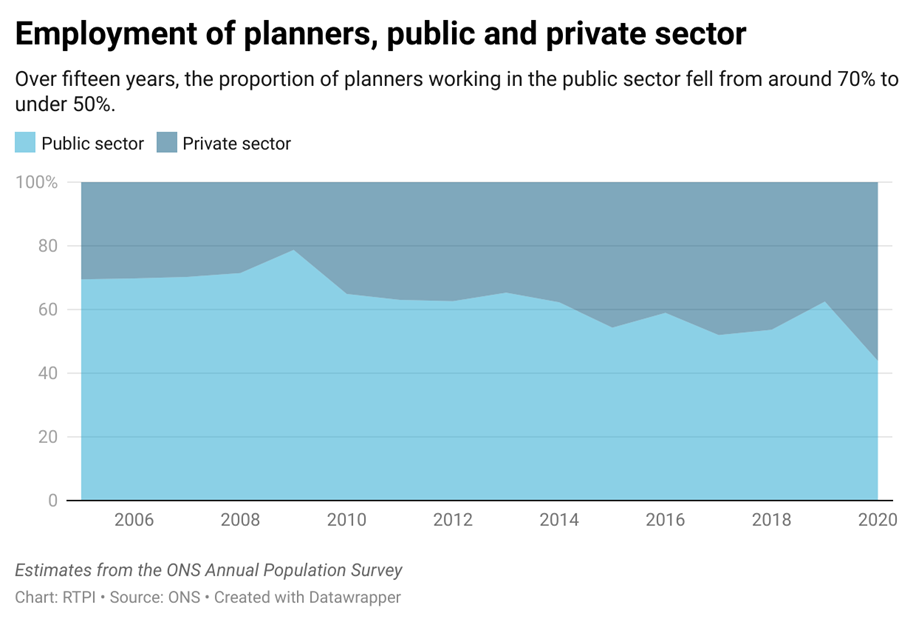
Figure 5
Public and private sectors
In 2019 we pointed out the trend of the increasing privatisation of the planning sector[15]. Quantitatively, this appears as a growing percentage of planners working in the private sector. On absolute terms, APS data shows that 25% of planners left the public sector just between 2013 and 2020. Controlling for inter-year variation over the last decade, we estimate an overall decline of 21-25%, while the private sector grew by two-thirds.
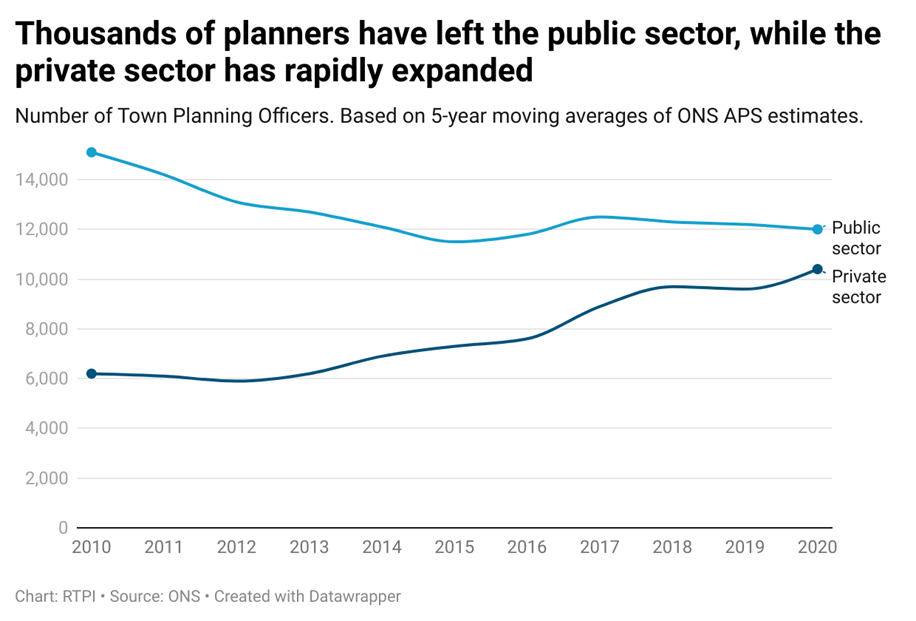
Figure 6
Explanations for this shift include the partial or total outsourcing of planning functions to independent consultancies or local authority-owned agencies, and changes in the “career conveyor belt.” While previously it was common practice for more senior planners in public sector jobs to move into higher-paid private sector positions, there is anecdotal evidence that this shift is now either occurring earlier in planners’ careers – or they are beginning their careers in the private sector.
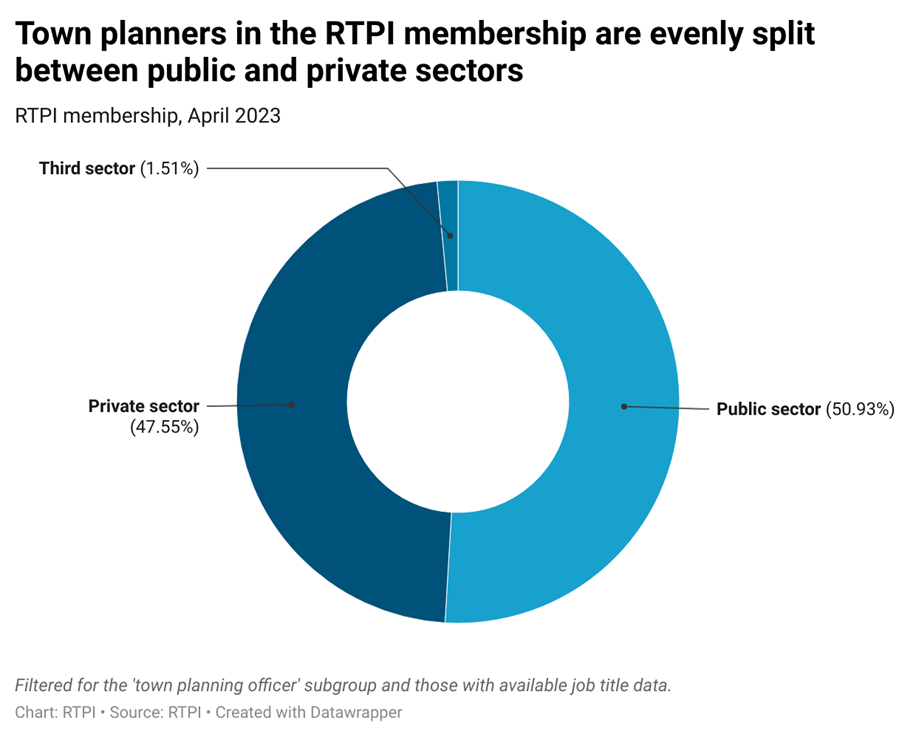
Figure 7
The RTPI membership exhibits similar trends, and allows more detailed insight into where planners work. The 16,000 RTPI members who we identified as planners for the purposes of this report[16] are roughly evenly split between public and private sectors, with a smattering of third sector employees. 86% of them work either in a local government or in a planning consultancy, which make up the majority of public and private sector employment respectively.
Based on national data, we estimate based that around 10% of planners are self-employed. This is a similar ratio as we estimated in 2019. It is difficult to know how this compares to the RTPI membership as the job-title-based filtering is particularly prone to misclassifying self-employed planners.
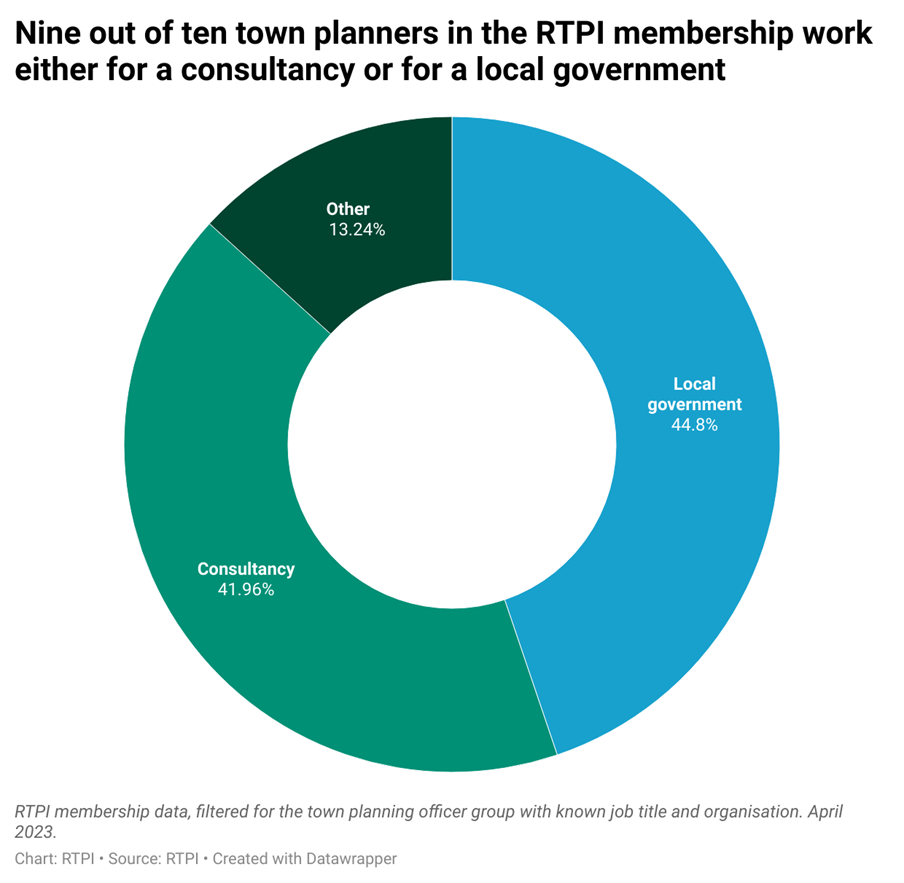
Figure 8
Other public sector employers include the national government and national agencies. Other private sector employers are house builders and architectural practices. The exact numbers working in these institutions (i.e. other than private consultancy, self-employment and local authorities) are in the hundreds. One limitation of our job-title-based methodology is that it has proven difficult to identify planners working for builders and architectural firms. It is possible that their job titles appear less planning-related and therefore in statistics they show up as “career changers” rather than a subset of the profession.
Based on the Annual Survey of Hours and Earnings, around 17,500 planners work full-time and 4,600 work part-time. The data on contract types is patchy, but indicates that the vast majority of planners are on permanent contracts.
Comparison to other built environment professions
Four years after our previous report, planning remains smaller compared to its two closely related built environment professions, that of Architects and Chartered surveyors. The proportion of the number of professionals in these fields remains near-constant as well.
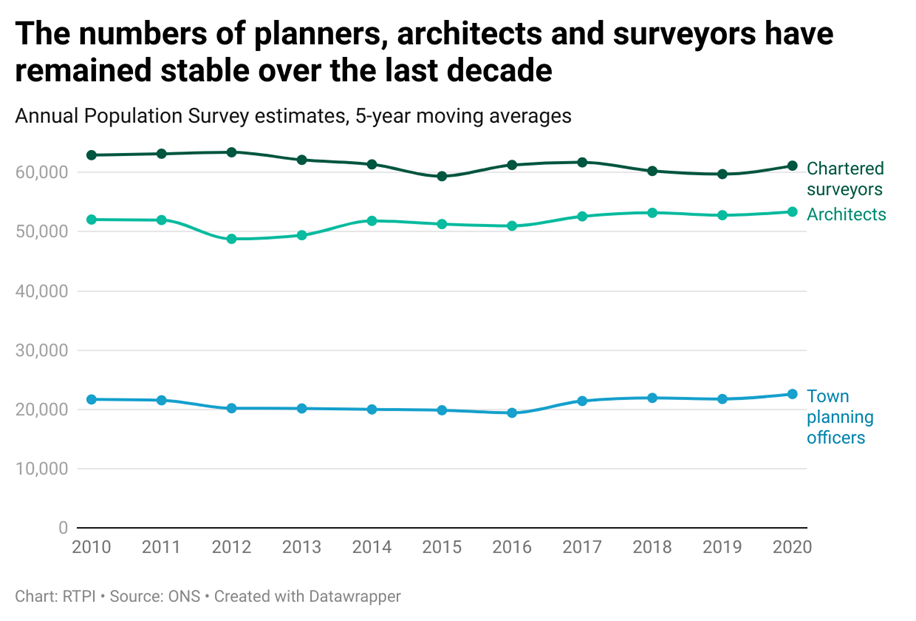
Figure 9
With all three professions showing roughly steady numbers, we estimate based on APS data that (rounded to the nearest 1000) there were around 23,000 planners, around
In the same period (2016-2020), the APS estimated an average of 50,000 quantity surveyors (unchartered), 5,000 Chartered Architectural Technologists, 74,000 Construction Project Managers and Professionals and 26,000 Architectural and Town Planning technicians.
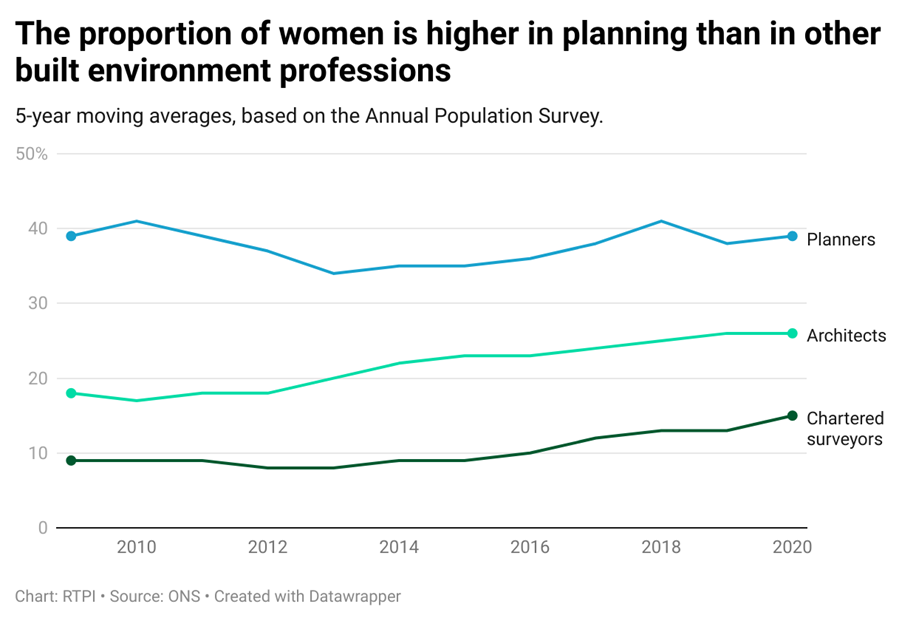
Figure 10
In 2020, 39% of planners, 15% of chartered surveyors and 20% or architects were estimated to be women . In comparison, the gender ratios in architecture and planning have remained largely static since APS estimates began in 2005, with a very slight upward trend for the percentage of women. At the same time, there is a clear increase of the proportion of women amongst chartered surveyors (from below 10% in 2009 to around 15% in 2020.)
We do not possess adequate national data to longitudinally compare professions based on inclusivity of race and ethnicity, disability or sexual orientation. This could be addressed in the future through data sharing between membership organisations corresponding to the other large BEPs (Royal Institute of British Architects and Royal Institute of Chartered Surveyors), and by improving standards of EDI data collected and held for research purposes.
The RTPI in international context
Based on RTPI membership data, there are 2,400 members with a primary contact address outside the United Kingdom (May 2023 data). Of them, approximately 800 are students.
While there are RTPI members in 80 countries and territories, just six of these (Hong Kong, Ireland, China, Australia, Canada and New Zealand) account for three-quarters of the international membership. Hong Kong has two RTPI-accredited planning schools with student members, and with a large number of students from mainland China. Ireland, Australia, Canada and New Zealand have strong ties to the UK planning community and employers in these countries often hire from each other’s talent pools.
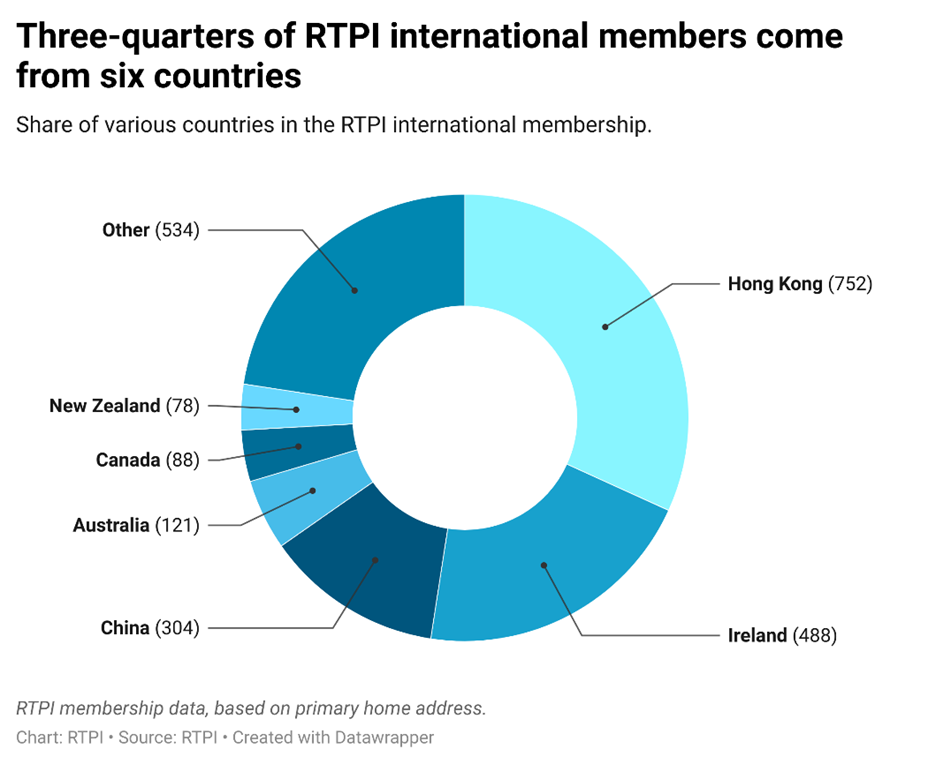
Figure 11
Education
RTPI-accredited planning schools
The RTPI accredits 33 planning schools around the world. Three are in Ireland, two are in Hong Kong, one is in Botswana and one in Cape Town, South Africa. The remaining are in the UK[18]. These institutions offered a total of 125 accredited planning courses in 2022, of which 22 were at the undergraduate level, 99 at the postgraduate level and one at a combined undergraduate-postgraduate level. They also offered eleven apprenticeships. In total, there are around 5,200 students in education in these schools as of 2022. 4,600 of them were in the United Kingdom.
RTPI student members
The RTPI has 3,600 student members in the United Kingdom (as of May 2023). With around 4,600 students in the UK this suggests an RTPI coverage of 78%, which is slightly higher than amongst working planners.
Amongst UK student members[19], there are slightly more women (52.46%) than men (47.54%). This is a higher proportion of women than in the UK planning profession as a whole, and higher yet than in the younger half of the RTPI membership.
Of UK student members 30.35% identified with a White ethnicity, 19.50% identified as an ethnicity corresponding to a racialised minority, and 6.74% did not wish to disclose with no data on 43.41% of the student population. This would still mean a much higher proportion of individuals from a racialised minority than either in the full membership or the profession in general. Of those students who provided data on nationality, 65% are British (including English, Scottish, Northern Irish and Welsh), 18% are Chinese, 4% are Indian and 1% are US American.
5 Key problems and challenges
Introduction
In this section we turn to the available evidence on the state of the wider planning system and the ways in which it impacts the planning profession and planning professionals. The UK has four different planning systems in England, Scotland, Wales and Northern Ireland[20] each with their own challenges. This survey reveals a range of shared themes related to planning system performance, public sector resourcing for planning and difficult-to-navigate policy environments. Evidence regarding prevalent issues like salaries, working conditions and public mistreatment have also been considered.
Shared themes across four nations
We argue that across the UK, planning systems and planning professionals face similar challenges, even if these are governed differently in the four nations. To sum it up: the administration of planning services at the local authority level became more difficult over the last decade. This is caused by a combination of lower levels of funding for planning services and an expansion of the range of duties for the planning system.
These difficulties have worsened the performance of the planning system, driven contraction of the public sector and expansion of the private sector, and have kept the salaries of planners down, making planning less attractive as a profession for young people. Efforts over the past three years to institute planning reform and added to these challenges, creating an uncertain and rapidly shifting policy environment.
These challenges have been experienced by individual planning departments and planning professionals in: difficulties to hire and retain planning talent; worsening working conditions; harassment and mistreatment from the public and the spread of disinformation online.
Resourcing planning departments
Local Planning Authorities (LPAs) are at the heart of our planning systems, wielding planning powers and enforcing planning decisions. Over the last decade, public investment in planning services decreased in England, Scotland and Wales.
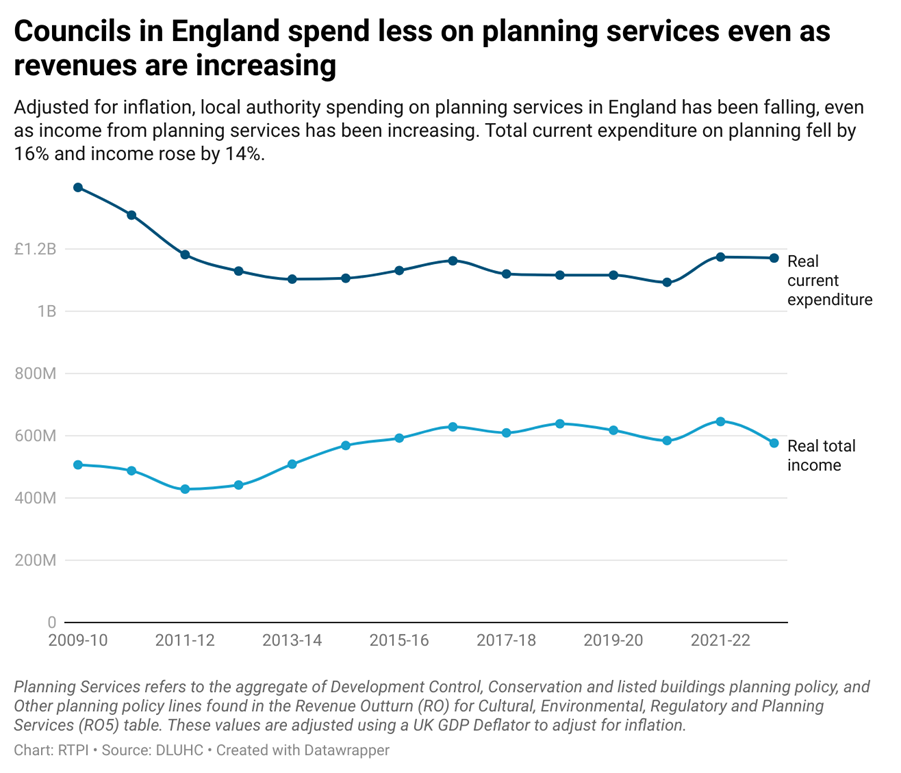
Figure 12
The most detailed available data on funding is from England. Total public expenditure on planning services in England contracted from £1.4 billion in the 2009-10 financial year by 16% to £1.17 billion in 2022-23 (when adjusted for inflation[21]). At the same time, income from planning services increased by 14% from £507 million to £577 million.
This means that growing income from planning services did not translate into more money spent on planning. This is because direct public investment in planning has been decreasing: real net current expenditure on planning services fell 33.34% between 2009- (from £893 million to £594 million)[22]. Planning fee increases scheduled for April 2024 (25% for minor and 35% for major applications) and tied to inflation are expected to slow the decline in LPA resourcing[23]. However, they are unlikely to reverse this trend without ringfencing the additional revenue for planning services or recovering the full costs of administering development control services[24]. These increases may also come too late to stop planned cuts in staff at some planning departments[25].
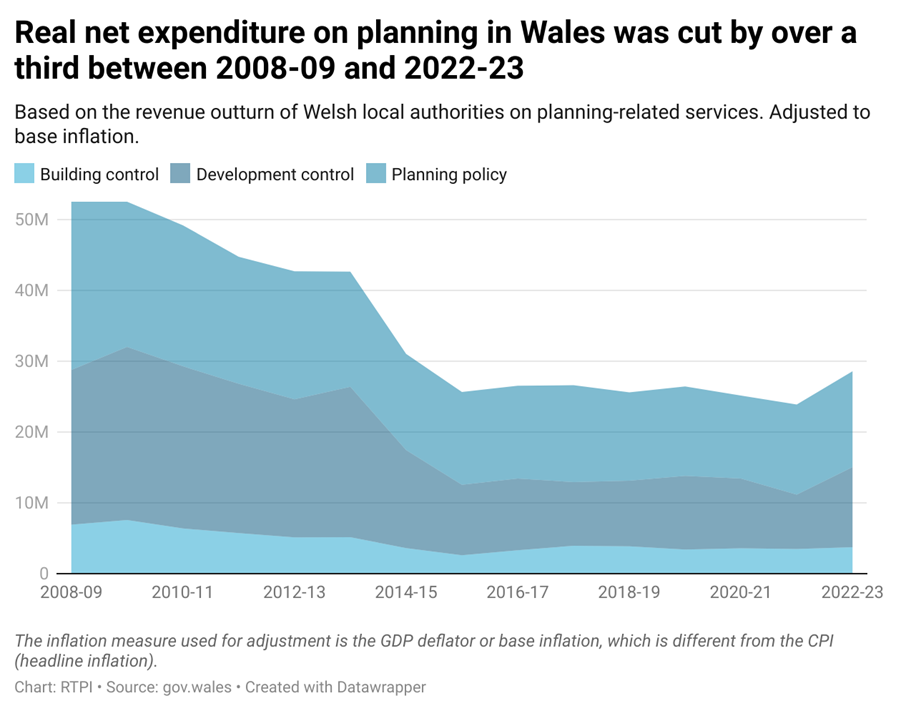
Figure 13
In Wales, net expenditure on planning was cut in half 2008 and 2021 on real terms, while the ambitious Planning (Wales) Act was introduced in 2015, putting high expectations on the planning system to implement policy and contribute to sustainable development[26]. Latest revenue outturn figures show a slight increase in net expenditure in 2022-23.
Earlier RTPI research[27] revealed that in Scotland, the budget for planning services saw a reduction of 38% between 2010 and 2022. A quarter of planning department staff was cut between 2009 and 2022, and planning fees income only covers 66% of processing costs. At the same time, the 2019 Planning (Scotland) Act introduced 49 unfunded duties for local authorities which could cost up to £50 million over ten years to implement.
Planning system performance
Across the UK, under-resourced national planning systems have been struggling to deliver on their expanding array of duties and traditional roles of policymaking, development control and enforcement.
In England, DLUHC noted in 2019 that since 2008-09, planning enforcement notices had declined by 30%[28]. An RTPI report in November 2022 found that 90% of local authorities in England “struggled with a backlog of planning enforcement cases[29].” Local plan and policy-making is specialist area, not to be covered by rising fees.
Development control can bring income from fees into local planning authorities but faces a similarly dire situation. Our earlier research showed that while in 2009, 85% of planning applications were processed within statutory time limits (and without performance agreements), by 2021, this number had reduced to 49%[30]. The Times recently reported that in England only 19 percent of planning applications are being processed within the mandated 13 weeks[31].
Government has introduced a Planning Skills Delivery Fund, which allocated £24 million over two years to clear planning backlogs[32]. Individual authorities applied to receive up to £100,000 each. However, as we have seen, the total national planning budget is around £1.17 billion. This means that £12 million pledged per year amounts to a minimal 1% increase in total council spending on planning. Given the magnitude of some post-pandemic backlogs this might not be sufficient to clear outstanding applications or prevent similar workload pressures from building up again.
A Scottish government report in 2022 emphasised the negative effects of the Covid-19 pandemic on planning system performance[33]. While 74% of local development applications were decided within the statutory two-month timeframe in 2019/20, in 2021/22 it was only 74%. The number of processing agreements (PAs) also increased, from 1981 in 2019/20 to 3284 in 2021/22, suggesting that departments are struggling to keep up with workloads. The number of major development applications also fell during the pandemic era, numbering 307 in 2019/20 and 285 in 2021/22. This might be due to the increase of the average decision time on major applications from 33.5 weeks to 44.6 weeks in the same period.
In Northern Ireland in 2022-23 the average processing time was 57.8 weeks (compared to national guidelines of 30 weeks)[34].
A Welsh government report on the period 2018/19 (a year before the pandemic) found that only two-thirds of applications were processed within statutory timeframes[35].
Overall, in all four nations we can observe a similar trend: underfunded, understaffed, overstretched planning departments struggling to keep up with their duties, a problem that has been further exacerbated by the pandemic. Planning fees rose to cover costs, but since these funds were not ring-fenced[36], budgets still contracted on real terms, the service got worse, and at the same time more expensive.
Policy uncertainty
There is evidence that government-led planning reforms have increased policy uncertainty, affecting plans and projects in England.
In England widely cited monitoring by the planning consultancy, Lichfields, suggests that Government’s Written Ministerial Statement regarding housing targets have caused delays and withdrawals of local plans at many local planning authorities across England. It was estimated that these barriers have led more than 11,000 homes and £1.4 billion of economic output to be foregone annually[37].
The Levelling Up, Housing and Communities Select Committee cited these delays as evidence of “stop-start planning reform”, resulting in uncertainty[38]. This has been exacerbated by the range of policy consultations on planning-related matters – listed below - that proposed significant changes to our planning system but rarely received timely responses from the Government. These have led planners in the public and private sector to exercise greater caution in their delivery to minimise operational and regulatory risk.
|
Consultation |
Duration for Government Response |
|
6 months |
|
|
"Closed with explanation" |
|
|
1 year 7 months |
|
|
3 months |
|
|
2 months |
|
|
More than 2 years 6 months |
|
|
More than 2 years 6 months |
|
|
National Infrastructure Planning Reform Programme: stakeholder survey |
1 year 7 months |
|
9 months |
|
|
6 months |
|
|
Partial. More than 8 months |
|
|
3 months |
|
|
More than 4 months |
|
|
More than 4 months |
|
|
More than 4 months |
|
|
Recently concluded |
|
|
Recently concluded |
|
|
Recently concluded |
Political contestation
Planning issues can be controversial and may become politically contested. This is because our planning systems are designed to serve the public interest, aim to be transparent with the public and give elected councillors responsibilities to make planning decisions, apply planning policies with due regard to legislation and case law and uphold procedural rules and rights of appeal that ensure fairness.
England’s May 2023’s local elections saw a significant number of councils changing control from one political party to another or have resulted in no single party having overall control. Political change can itself introduce barriers in the operation of the planning system in a number of ways.
RTPI members have suggested[39] that planning decisions and the preparation of local plans and planning policy documents can become more difficult with changes of political leadership. Political factors can frustrate plan-making in areas where councillors “may struggle to reach the agreements needed to begin Local Plan preparation”. Similarly, it has been suggested that “councils that elect by thirds annually may also need to pause preparations for regular elections or may be subject to greater political uncertainty”.
Research assessing the barriers to plan-making has suggested that requirements – since 2012 – for councils to decide their overall level of development in local plans has made them more difficult to prepare[40] and, in some cases, so highly politicised that local plans preparations have been avoided all together.
Evidence from recently abandoned joint plans in the West of England[41] and Black Country[42] suggest that political contestation and the resulting disagreements between councils have been an insurmountable barrier to strategic planning on important cross-boundary issues across jurisdictions.
Political contestation (within and between parties) has also impacted the operation of our planning system at a national level. Progress on national planning reforms were impeded after the 2021 Chesham and Amersham by-election, creating significant uncertainty as explained in this report. Tensions between national, mayoral and local ambitions - as shown in recent responses from around Cambridge to the Government’s ‘Long-term plan for Housing’[43] or over transport planning issues like HS2 – can create further uncertainty for planners.
In recognition of these issues, the RTPI’s ‘2024 Planifesto’ has called for political parties to “Explain where [their] manifesto promises will be delivered” in the run-up to the next General Election[44].
Salaries
The Annual Survey on Hours and Earnings, part of the labour force survey, allows us to estimate how the median salaries of town planners have changed over time. Due to low sample sizes, we must be cautious about any individual data point. Furthermore, we should expect significant geographic and demographic variation, which current data sources capture poorly. However, the general point stands: on the whole, town planners are more poorly paid today than they were in 2005. The nominal median salary over the past 17 years has hovered around £33,000. That means that in today’s money, the median planner was making close to £50,000 a year in 2005.
Non-representative survey-based research by the BAME Planners Network found in 2021 that at a given level of qualification, “Black/African/Caribbean/Black British respondents and Asian and Asian British respondents were [paid annually] £3,900 and £9,000 less respectively”[45] than White respondents. 24% of respondents identifying with Black, Asian and minority ethnicities felt undervalued and/or underpaid in their workplace.
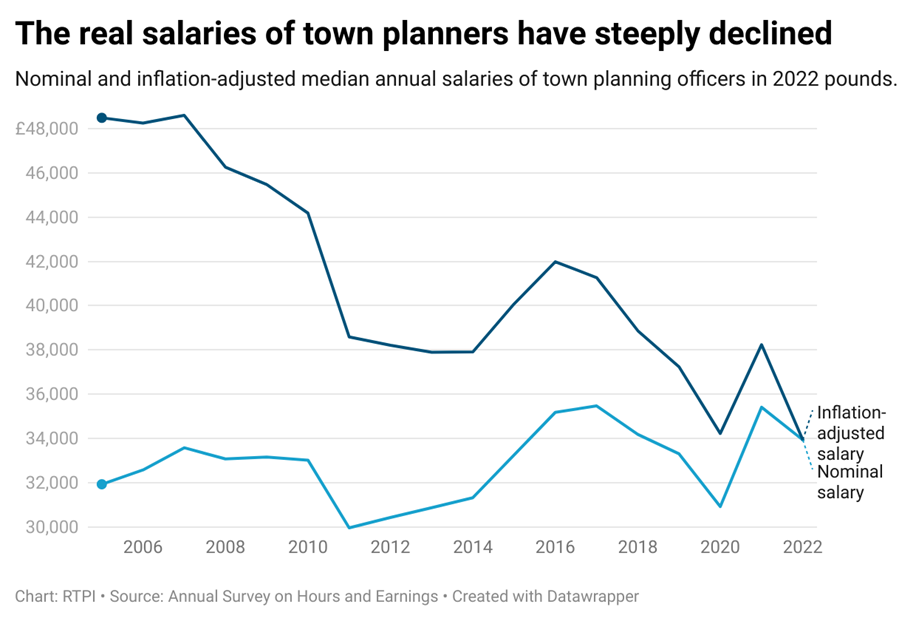
Figure 14
A crucial gap in data is regional and inter-sector variation. Another is related to gender: sample sizes for town planners in the LFS are generally too small to treat the gender-based breakdowns of salaries with any level of confidence. Future research could address this by some combination of processing job board data and surveying the RTPI membership. The BPN survey cited above might be an important model in this regard. This would also ensure more robust and reproducible data, and would lower reliance on low-sample national statistics.
Underfunding of planning services makes it impossible for local authorities to pay a fair market rate for the professional expertise of planners. While anecdotal evidence suggests that salaries are higher in the private sector than in the public sector, as the public sector still makes up 50% of the profession, uncompetitive salaries in this sector will exercise a downward push on salaries as a whole. This makes planning a less attractive career path for planners (who likely invested heavily in their training and qualifications) and leads to labour shortages.
Workforce shortages
In 2022, the Local Government Association’s workforce survey revealed that 58% of local authorities in England struggled to hire as many planners as they wanted to, the highest percentage for any profession within the LA workforce[46]. In 2019, before the pandemic, Planning Advisory Service surveys of local authorities in England suggested that about 10% of positions remain unfilled long-term[47]. Given the overall number of around 10,000 planners working in the public sector[48], this meant around 1,000 prolonged vacancies. A research report by EKOS commissioned by the RTPI suggests that we can expect a 12.5% increase in the number of planners needed between 2021 and 2031[49].
A more recent round of Freedom of Information requests sent by the Local Government Chronicle to local authorities in England (and with a response rate of 80%) found evidence of “only one in 10 council planning departments fully staffed”[50]. RTPI analysis on the same dataset identified an average vacancy rate of 14%, and a total number of over 1500 vacancies in responding councils, which is substantially higher than earlier estimates.
Lack of capacity in local authorities seems to be driven by under-funding. The inability of councils to compete on salary is underlined by the results of an RTPI survey distributed through our membership bulletin in spring 2023. 82% of respondents working for local authorities said their employer had had difficulties hiring planners in the previous 12 months. 68% agreed or strongly agreed that offering a competitive salary to planners is one of the key difficulties for local authorities (only 34% in different organisation types). Testimonials obtained from free-form survey answers further underline this point:
“We have been carrying several vacant posts for the last 2 years. We have tried to fill a senior policy officer post three times without success. We did fill other more junior posts but the officers left after a few months for better jobs elsewhere.”
“There is a real lack of more senior planners - the 'middle tier' which is very difficult to recruit for locally in South Wales.”
“There is general lack of planners in England and young graduates like to work for Private Sector as they offer better wages.”
However, as we have seen in earlier sections, the overall real median salary of all planners has been falling. We might hypothesise that the effective salary ceiling in local authorities necessitated by low funding for planning services exercises a downward push on wages in the private sector as well. This then lowers the attractiveness of the profession as a career path in both public and private sectors. There is some anecdotal evidence of this as well:
“We are a private consultancy and find recruitment difficult and increasingly challenging to be competitive with salaries. In planning there are three tiers - LPA, private consultancy and housebuilder/promoter. All are recruiting from the same pool and two of those groups are becoming increasing unable to compete with the salaries offered by housebuilders and promoters.”
Working conditions
In 2022, the RTPI surveyed 209 Welsh planners to find out more about their mental wellbeing and working conditions. The results reveal that those working for LPAs feel overstretched “several or more times a week”, in contrast to only occasionally in other sectors, like private consultancy. 37.1% of enforcement planners, 29.2% of development management planners and 27.1% in management feel overstretched “all the time”.
About 60% of respondents reported an increase of workload in the past two years. 20% of LPA respondents “never have enough time” to carry out assigned workloads, while 50% encounter time crunches at least periodically. The most cited reason was the “lack of staff resource”, as employees often have to cover for missing staff. During the pandemic period, this was compounded by prevalent sick leaves.
While these results are from Wales, they are likely a good indication of working conditions across nations: as backlogs grow and staffing remains difficult, it is common for hours to drag on longer and stress to build. In the same sample of Welsh planners, 15% of those working for LPAs were looking to exit the planning sector and 24% were looking for another planning job in hope of better compensation and conditions.
Mistreatment and disinformation
The Wales survey highlighted another challenge planners face in recent years: disinformation and online harassment. 58% of those surveyed said that social media negatively affected their well-being as professionals. They highlighted that people feel a lot freer to express themselves violently or impulsively online.
More recently, a survey by the RTPI-affiliated Planner magazine found that as much as 87% of planners feel that social media is fuelling misinformation about local planning issues. This includes spreading rumours about planners accepting bribes, or representing the planning system as a top-down, authoritative one, disregarding the democratic element of consultation. Local Facebook groups were highlighted as the worst culprits, where unsubstantiated allegations can spread without recourse or burden of proof.
6 Conclusion
Planning in the 21st century is vital for managing the challenges of climate change, pandemics, housing shortages and public health. To support effective planning policies, it is essential to understand the current state of the profession. This report by the RTPI provided an updated look at the size, demographics, employment patterns and challenges facing the UK planning profession, following up on the 2019 State of the Profession report.
The main findings are:
- There are around 22,000 professional planners in the UK as of 2023. This number is stable compared to 2019.
- Women now comprise 40% of planners, with near gender parity amongst professionals under age 42. Racial diversity remains limited but is increasing.
- Around 75-80% of planners are RTPI members.
- There are over 5,000 students in accredited planning programs.
- Approximately 50% of planners now work in the private sector, especially in consultancies. Public sector employment has declined.
- Real median salaries for planners have fallen steadily over the past 15 years.
- Resourcing challenges, skills shortages and political uncertainty pose challenges for public sector planning across the four nations.
Data quality issues in the Annual Population Survey complicated analysis. More reliable, granular data collection on the profession is needed. There is minimal data on diversity related to disability, socioeconomic status and sexual orientation in the profession currently. Improving metrics on these fronts is an important objective. While this report focused on the UK, more comprehensive international comparisons of the planning profession could provide helpful context.
While maintaining steady overall numbers, the planning profession faces significant strains stemming from the under-resourcing of planning departments, especially in local authorities. Providing adequate, ring-fenced funding for local authorities to deliver efficient, high-quality planning services is crucial. Effective local leadership and constructive community participation are also important when addressing current planning system challenges. With proper support, the planning profession can play a vital role in sustainably shaping built environments to meet pressing needs. However, continuing to neglect resourcing needs will only lead to deeper problems.
References
BAME Planners Network. “Diversity and Inclusion in the Workplace Survey.” BAME Planners Network, 2023. https://199c34ad-6d86-4f1e-b661-52f4c23ec72f.usrfiles.com/ugd/199c34_e7e01420dcf149f39df1864d359ba4c6.pdf.
Cuffe, Grainne. “Northern Ireland Councils Exceed Target Planning Application Processing Time by 93%.” Inside Housing, 2023. https://www.insidehousing.co.uk/news/northern-ireland-councils-exceed-target-planning-application-processing-time-by-93-82222.
Department of Levelling Up, Housing and Communities. “Planning Skills Delivery Fund (Year 1): Guidance for Applicants.” GOV.UK, August 24, 2023. https://www.gov.uk/guidance/planning-skills-delivery-fund-year-1-guidance-for-applicants.
DLP Strategic Planning Research Unit. “Local Plan Preparation: Barriers and Opportunities,” October 2023. https://www.rtpi.org.uk/media/15954/101823g5143psrtpi-local-plan-research.pdf.
EKOS. “RTPI Baseline,” 2022.
Grimwood, Gabrielle Garton. “Planning Enforcement in England.” House of Commons Library, 2019. https://researchbriefings.files.parliament.uk/documents/SN01579/SN01579.pdf.
Heads of Planning Scotland and RTPI Scotland. “Future Planners Project Report,” 2022. https://www.rtpi.org.uk/media/12040/future-planners-project-report.pdf.
Kenny, Tom. “The UK Planning Profession in 2019.” Royal Town Planning Institute, 2019. https://www.rtpi.org.uk/research/2019/june/the-uk-planning-profession-in-2019/.
Kenyon, Megan. “Revealed: Capacity and Churn Issues Facing Planning Teams.” Local Government Chronicle (LGC) (blog), May 16, 2023. https://www.lgcplus.com/services/regeneration-and-planning/revealed-capacity-and-churn-issues-facing-planning-teams-16-05-2023/.
Levelling Up, Housing and Communities Committee. “Reforms to National Planning Policy,” 2023. https://committees.parliament.uk/publications/40872/documents/199083/default/.
Local Government Association. “2022 Local Government Workforce Survey.” Local Government Association, 2022. https://www.local.gov.uk/sites/default/files/documents/LG%20Workforce%20Survey%202022%20-%20Final%20for%20Publication%20-%20Tables%20Hard%20Coded.pdf.
Megan Kenyon. “Warning That Planning Fees Increase Comes Too Late.” Local Government Chronicle (LGC) (blog), April 25, 2023. https://www.lgcplus.com/services/regeneration-and-planning/planning-fees-increase-too-late-to-prevent-staff-cuts-25-04-2023/.
Office for National Statistics. “Ethnic Group by Age and Sex, England and Wales,” 2023. https://www.ons.gov.uk/peoplepopulationandcommunity/culturalidentity/ethnicity/articles/ethnicgroupbyageandsexenglandandwales/census2021.
———. “International Migration, England and Wales,” 2022. https://www.ons.gov.uk/peoplepopulationandcommunity/populationandmigration/internationalmigration/bulletins/internationalmigrationenglandandwales/census2021.
———. “Jobrecords.Txt in Dp-Classification-Tools,” 2017. https://github.com/ONSdigital/dp-classification-tools/blob/90760bb8e0a895f83c5ace8ed5e3f3cbdaa6be46/standard-occupational-classification/data/jobrecords.txt.
———. “National Identity, England and Wales,” 2023. https://www.ons.gov.uk/peoplepopulationandcommunity/culturalidentity/ethnicity/bulletins/nationalidentityenglandandwales/census2021.
Parkes, Thomas. “Controversial Black Country Housing Plan Ripped up as All Councils to ‘Go It Alone,’” October 14, 2022. https://www.expressandstar.com/news/local-hubs/wolverhampton/2022/10/14/controversial-housing-plans-for-the-black-country-will-be-split-into-four-chiefs-have-said/.
Planning Advisory Service. “Survey of Planning Departments 2019.” 2019. https://www.local.gov.uk/pas/our-work/gdpr-data-and-surveys/survey-planning-departments-2019.
Porter, Toby. “Cambs Councils and MP Slam Reported 250,000-Home ‘Silicon Valley’ Proposals.” Planning Resource, July 11, 2023. https://www.planningresource.co.uk/article/1829621?utm_source=website&utm_medium=social.
Royal Town Planning Institute. “About the RTPI,” 2020. https://www.rtpi.org.uk/about-the-rtpi/.
———. “Almost 90% of Local Authorities Surveyed Struggling with Backlog of Planning Enforcement Cases,” 2022. https://www.rtpi.org.uk/news/2022/november/almost-90-of-local-authorities-surveyed-struggling-with-backlog-of-planning-enforcement-cases/.
———. “Become a Planner: Study at University,” 2020. https://www.rtpi.org.uk/become-a-planner/study-at-university/.
———. “Local Plan Preparation: Briefing,” October 2023.
———. “Planning for a Better Future.” Policy paper. Royal Town Planning Institute, 2020. https://www.rtpi.org.uk/policy-and-research/planning-for-a-better-future/.
———. “Research Strategy 2022-2024.” Royal Town Planning Istitute, 2022. https://www.rtpi.org.uk/media/11589/rtpi-research-strategy-2022-24-for-publication.pdf.
———. “RTPI Planifesto 2024,” 2023. https://www.rtpi.org.uk/planifesto.
———. “RTPI Response to Consultation on Planning Fees and Local Authority Performance,” 2023. https://www.rtpi.org.uk/consultations-rtpi/2023/april/rtpi-response-to-consultation-on-planning-fees-and-local-authority-performance/.
———. “The Big Conversation: The Well-Being of Planners and the Impact on the Planning System in Wales.” Royal Town Planning Institute, 2023. https://www.rtpi.org.uk/media/13659/big-conversation.pdf.
RTPI Scotland. “Resourcing the Planning Service: Key Trends and Findings 2022.” Royal Town Planning Institute. Accessed September 26, 2023. https://www.rtpi.org.uk/research/2022/december/resourcing-the-planning-service-key-trends-and-findings-2022/.
RTPI South West, and Geoff Walker. “The On-Going Saga of Strategic Planning in the West of England Has Taken a Further Turn,” 2020. https://view.officeapps.live.com/op/view.aspx?src=https%3A%2F%2Fwww.rtpi.org.uk%2Fmedia%2F5566%2Fthe-ongoing-saga-of-woe-strategic-planning-jan-2020.doc&wdOrigin=BROWSELINK.
Scottish Government. “Planning Performance Statistics 2021/2022: Annual and Quarterly (October 2021 to March 2022).” Scottish Government, 2022. https://www.gov.scot/publications/annual-planning-performance-statistics-2021-22/.
Steele, Harry, and Madeleine Bauer. “Planning Agencies: Empowering Public Sector Planning.” Royal Town Planning Institute, 2022. https://www.rtpi.org.uk/media/12613/planning-agencies-rtpi-2022.pdf.
The Times. “The Times View on Housebuilding: Planning for Defeat.” The Times, July 10, 2023, sec. comment. https://www.thetimes.co.uk/article/the-times-view-on-housebuilding-planning-for-defeat-bx3nhqpvp.
Tidswell, Isabella. “Start Me up – but Then You Stopped: The Continuing Cost of Local Plan Delays.” Lichfields (blog), 2023. https://lichfields-co-uk.azurewebsites.net/blog/2023/january/30/start-me-up-but-then-you-stopped-the-continuing-cost-of-local-plan-delays/.
Welsh Government. “Planning Services Annual Performance Report: 2018 to 2019.” Welsh Government, 2020. https://www.gov.wales/sites/default/files/publications/2020-01/planning-services-annual-performance-report-2018-to-2019_0.pdf.
Winter, Graham. “Comparison of the Planning Systems in the Four UK Countries,” 2016. https://senedd.wales/Research%20Documents/16-001%20-%20Comparison%20of%20the%20planning%20systems%20in%20the%20four%20UK%20countries/16-001.pdf.
Appendix 1: Data sources[51]
National data sources
Office for National Statistics – Annual Population Survey
Our main source of time-series data is the Office of National Statistics (ONS)'s Annual Population Survey tables, based on the Annual Labour Force Survey. These statistics go back to 2005 and are published every 6 months. They are based on a 1% representative sample of the working population. Data is available based on occupational classification.[52]
Given the small number of town planners, there is significant inter-year variation. Therefore, to ascertain the number of planners with higher confidence, both the 2019 and the current version of this report uses 5-year moving averages, which are rounded to the nearest 100.
However, recent APS data presents challenges. Firstly, the ONS informed us that there is uncertainty surrounding the data in 2021 because of a coding error in the occupational classification.[53] For this reason, the 2021 values were excluded.
Secondly, in 2022, the ONS switched to the new SOC2020 occupational coding system[54], which no longer categorises Town Planning Officers as a standalone group. Methods of conversion between the new grouping and the old one were judged to be unreliable, so results for 2022 are excluded for now.
Department for Levelling Up, Housing and Communities public expenditure data
The Department of Levelling up, Housing and Communities produces regular data on public spending on the financing local authorities in general and planning services in particular, in England.[55] We can use these datasets and, adjusted to inflation,[56] ascertain the funding situation of planning in the public sector.
RTPI data
RTPI membership data
The RTPI is the biggest professional organisation for town planners in the United Kingdom and Ireland. It is the only institute with the power to award chartered status to planners. Therefore our membership represents the majority of the UK planning profession, and our membership database is the most detailed and extensive of its kind.
Internal data of RTPI departments
The RTPI Higher Education and Membership departments provided this report with their independent analysis and figures, chiefly on the composition of membership (and net change year-on-year), and on the number of partnered higher educational institutions and their student counts.
RTPI survey on planner shortages and immigration
In March-April 2023 we ran a survey through the RTPI members’ bulletin prompting members to provide information about the difficulties of hiring planners at their organisation, and their attitudes towards employing planners without UK or Irish citizenship. These results were incorporated into the sections on skills shortages.
Third-party data
Local Government Workforce Survey
The LGWF is an annual survey conducted by the Local Government Association.[57] Focusing on local authorities in England, it provides useful information on the role of planners within local government, the constitution of the average planning team (its division between policy, development management and enforcement), and the difficulties local authorities face in recruiting planners.
Local Government Chronicle staffing survey
The LGC sent out a comprehensive set of Freedom of Information Requests to all local authorities in England with questions concerning a) the difficulties involved in staffing planning departments and b) the practice of outsourcing planning activities to private agencies and consultancies. This data forms an important component in our assessment of current affairs and the planner shortage.[58]
[1] 74-82% depending on which estimate we use.
[2] Royal Town Planning Institute, “About the RTPI.”
[3] Royal Town Planning Institute, “Research Strategy 2022-2024.”
[4] Kenny, “The UK Planning Profession in 2019.”
[5] Kenny.
[6]Ideally, we would have a way to filter 3121 for planners only, but there is no way to distinguish this sub-group from architectural technicians and other professionals included. According to the PAS Resource Survey, we can expect the average planning department to have around 8% of its planning team as enforcement planners. In the total profession, this might mean a maximum of 4% of enforcement planners, some of them already counted in 2432. This means that we have <4% uncounted enforcement planners, which is within the error range of our estimates anyway.
[7] Office for National Statistics, “Jobrecords.Txt in Dp-Classification-Tools.”
[8] Detailed documentation on this point of the methodology can be found in Appendix 2: Data tables and technical documentation.
[9] Office for National Statistics, “Ethnic Group by Age and Sex, England and Wales.”
[10] There was not a large enough sample in 2019 and 2020.
[11] Office for National Statistics, “National Identity, England and Wales.”
[12] Office for National Statistics, “International Migration, England and Wales.”
[13] Heads of Planning Scotland and RTPI Scotland, “Future Planners Project Report.”
[14] For a detailed breakdown (though unreliable) see the Technical Documentation.
[15] Kenny, “The UK Planning Profession in 2019.”
[16] See Appendix 2: Data tables and technical documentation.
[17] Note that the basis of comparison here is 2020 and is based directly on the APS data rather than our 2023 estimates used in the previous section.
[18] Royal Town Planning Institute, “Become a Planner: Study at University.”
[19] Note that this category includes paid student members who are not on accredited courses.
[20] Winter, “Comparison of the Planning Systems in the Four UK Countries.”
[21] Inflation here measured through the GDP deflator (a measure of base inflation in the economy), as opposed to the headline Consumer Price Index or CPI, which focuses on prices of consumer goods.
[22] Net current expenditure is the total amount spent on planning services, minus the income from planning services (mostly planning fees). It is therefore an indicator of public investment in planning services.
[23] Royal Town Planning Institute, “RTPI Response to Consultation on Planning Fees and Local Authority Performance”, question 7.
[24] Royal Town Planning Institute, “Planning for a Better Future,” sec. 2.3.
[25] Megan Kenyon, “Warning That Planning Fees Increase Comes Too Late.”
[26] Royal Town Planning Institute, “The Big Conversation.”
[27] RTPI Scotland, “Resourcing the Planning Service.”
[28] Grimwood, “Planning Enforcement in England.”
[29] Royal Town Planning Institute, “Almost 90% of Local Authorities Surveyed Struggling with Backlog of Planning Enforcement Cases.”
[30] Steele and Bauer, “Planning Agencies: Empowering Public Sector Planning.”
[31] The Times, “The Times View on Housebuilding.”
[32] Department of Levelling Up, Housing and Communities, “Planning Skills Delivery Fund (Year 1).”
[33] Scottish Government, “Planning Performance Statistics 2021/2022: Annual and Quarterly (October 2021 to March 2022).”
[34] Cuffe, “Northern Ireland Councils Exceed Target Planning Application Processing Time by 93%.”
[35] Welsh Government, “Planning Services Annual Performance Report: 2018 to 2019.”
[36] Royal Town Planning Institute, “RTPI Response to Consultation on Planning Fees and Local Authority Performance,” sec. 7.
[37] Tidswell, “Start Me up – but Then You Stopped.”
[38] Levelling Up, Housing and Communities Committee, “Reforms to National Planning Policy.”
[39] Royal Town Planning Institute, “Local Plan Preparation: Briefing.”
[40] DLP Strategic Planning Research Unit, “Local Plan Preparation: Barriers and Opportunities.”
[41] RTPI South West and Walker, “The On-Going Saga of Strategic Planning in the West of England Has Taken a Further Turn.”
[42] Parkes, “Controversial Black Country Housing Plan Ripped up as All Councils to ‘Go It Alone.’”
[43] Porter, “Cambs Councils and MP Slam Reported 250,000-Home ‘Silicon Valley’ Proposals.”
[44] Royal Town Planning Institute, “RTPI Planifesto 2024.”
[45] BAME Planners Network, “Diversity and Inclusion in the Workplace Survey.”
[46] Local Government Association, “LG Workforce Survey 2022.”
[47] Planning Advisory Service, “Survey of Planning Departments 2019.”
[48] Kenny, “The UK Planning Profession in 2019.”
[49] EKOS, “RTPI Baseline.”
[50] Kenyon, “Revealed: Capacity and Churn Issues Facing Planning Teams.”
[51] Please note that Appendix 2: Data tables and technical documentation can be found as a separate document uploaded alongside this one.
[52]https://www.ons.gov.uk/employmentandlabourmarket/peopleinwork/employmentandemployeetypes/methodologies/annualpopulationsurveyapsqmi
[53]https://www.ons.gov.uk/employmentandlabourmarket/peopleinwork/employmentandemployeetypes/articles/theimpactofmiscodingofoccupationaldatainofficefornationalstatisticssocialsurveysuk/2022-09-26
[54]https://www.ons.gov.uk/methodology/classificationsandstandards/standardoccupationalclassificationsoc/soc2020
[55] https://www.gov.uk/government/collections/local-authority-revenue-expenditure-and-financing
[56] https://www.gov.uk/government/collections/gdp-deflators-at-market-prices-and-money-gdp
[57] https://www.local.gov.uk/publications/2022-local-government-workforce-survey
[58] Some of the findings are poublished here: https://www.lgcplus.com/services/regeneration-and-planning/planning-people-go-from-council-to-council-chasing-the-money-17-05-2023/


