 This report considers the size and makeup of the planning profession. It uses Annual Population Survey (APS) data on individuals working in the UK who describe Town Planning Officer as their main occupation.
It also draws on the RTPI's membership records and the RTPI Member Survey 2017, both filtered to focus on UK planners who would be likely to fit in the APS occupational group.
You can read the full report below or Click here to download in PDF. A technical report with a full set of tables is also available to download here.
Chapters
- Chapter 2 explores the size of the planning profession and the number of RTPI members currently working in it. We estimate that there are around 22,000 planners currently working in the UK, about three-quarters of whom are RTPI members.
- Chapter 3 explores the demographics of UK planners. We estimate that around two-fifths of planners are women and three-fifths of planners are men. The most common age group for planners is 35 to 44 (just under a third of the total).
- Chapter 4 explores the national and regional split of planners in the UK, and suggests it is similar to the overall working population. We estimate there are around 18,300 planners working in England, 2000 in Scotland, 1000 in Wales, and 600 in Northern Ireland.
- Chapter 5 makes estimates about the employers of UK planners. About 44% of planners work mainly in the private or third sectors compared to 56% in the public sector, and there appears to be a trend towards a greater proportion of planners employed in the private sector in recent years.
- Chapter 6 considers the built environment profession in the EU. Using the European Labour Force Survey it estimates that there are around 87,000 planners in the EU. It also finds major variation between countries in terms of the relative size of each individual profession.
- Finally, we conclude by considering the finding's reliability and remaining research gaps.
Contents
2. The number of planners in the UK
4. National and regional breakdown
5. Who are planners employed by?
6. Built environment professions in the EU
Executive summary
This report considers the size and makeup of the planning profession. It uses Annual Population Survey (APS) data on individuals working in the UK who describe Town Planning Officer as their main occupation. It also draws on the RTPI’s membership records and the RTPI Member Survey 2017, both filtered to focus on UK planners who would be likely to fit in the APS occupational group. This is a somewhat limited conception of what constitutes a planner but it likely captures most of the profession. We also compare planning with other built environment professions.
Chapter 2 explores the size of the planning profession and the number of RTPI members currently working in it. We estimate that there are around 22,000 planners currently working in the UK, about three-quarters of whom are RTPI members. This makes the profession smaller than other built environment professions.
Chapter 3 explores the demographics of UK planners. We estimate that around two-fifths of planners are women and three-fifths of planners are men. The most common age group for planners is 35 to 44 (just under a third of the total). The APS estimates that roughly a third are under 35 and a third over 45. If this is correct the RTPI membership is slightly older than the profession as a whole. Compared to other built environment professions planning has a higher proportion of women and under 40s and a lower proportion of Black, Asian and Minority Ethnic (BAME) individuals.
Chapter 4 explores the national and regional split of planners in the UK, and suggests it is similar to the overall working population. We estimate there are around 18,300 planners working in England, 2000 in Scotland, 1000 in Wales, and 600 in Northern Ireland.
Chapter 5 makes estimates about the employers of UK planners. About 44% of planners work mainly in the private or third sectors compared to 56% in the public sector, and there appears to be a trend towards a greater proportion of planners employed in the private sector in recent years. There are around 11,400 planners in the UK at least partially employed by local planning authorities. Planners in England are the least likely to have at least one public sector employer. Amongst wider built environment professionals planners are the least likely to be self-employed (11-13% of the total) and the most likely to be employed in the public sector.
Similarity between the datasets suggests that RTPI members are representative of the wider profession. Estimates from RTPI member data are close to APS estimates about planners in almost every area we considered, including demographics, geographic spread, and sector.
Chapter 6 considers the built environment profession in the EU. Using the European Labour Force Survey it estimates that there are around 87,000 planners in the EU. It also finds major variation between countries in terms of the relative size of each individual profession. This may indicate different boundaries for professions in different countries and/ or relative levels of support for place making.
Finally, we conclude by considering the finding’s reliability and remaining research gaps.
1. Introduction
Despite its importance to society, there has been relatively little evidence published on the size and structure of the planning profession in the UK. This is not just an academic issue – there are huge environmental, social and economic issues arising from the way we control land from the housing crisis to climate change. To ensure we can rise to meet these issues, we need to know that the expertise is in place. This makes understanding the size and structure of the planning profession crucial to informing our response.
This research explores the UK planning profession through secondary analysis of data from RTPI and the Office for National Statistics (ONS). It provides the best estimates to date of the size and makeup of the profession and identifies gaps in available knowledge.
This is just one stage in a programme of work which will consider the profession in more detail as well as the level and adequacy of resourcing of public sector planning, the pipeline into the profession, and the diversity of the profession as it is now and as it could be in the future.
1.1 Research Aims
- Estimate the size of the planning profession in the UK.
- Estimate how the profession is distributed, for example by employer and demographics.
- Determine how useful existing data on the profession is and identify knowledge gaps.
1.2 Methodology
The analysis reported here is based on secondary analysis of four sources of data on the extent of the planning profession across the UK.[1]
- The Office of National Statistics’ Annual Population Survey (APS), which is the most robust source of workforce statistics at the UK level.
- The RTPI Member Survey 2017 (filtered for ‘UK town planning officer’ group).
- RTPI membership records (filtered for ‘UK town planning officer’ group).
- The European Labour Force Survey (EU LFS), which provides workforce statistics for countries across the EU.
As far as we know these are the only sources of quality data relating to the planners across all sectors and the UK. For each area of interest we report on and compare the results of each of these datasets. More detail on the methodology is available in the technical report, along with a full set of tables.
The Annual Population Survey (APS)
The APS is drawn from the Labour Workforce Survey plus an additional boost, ending up with a total sample of about 300,000 households. The survey randomly samples addresses, and asks the head of the household to report information about all the individuals who live there. It is published by the ONS every year, reporting on the period of October-September. This series goes back to 2005. This data is particularly useful as (1) it is high quality sample published by ONS, and (2) it gives an indication of the size and makeup of whole planning profession rather than just RTPI members.
One of the questions asks about the occupation of everyone in the household[2]. Participants must pick from a list covering 369 different occupations, grouped into 90 Minor Groups, 25 Sub-Major Groups, and 9 Major Groups. ‘2432 Town planning officer’ falls within the Minor Group ‘Architects, Town Planners, and Surveyors’. Other built environment professions are also included.
We believe the APS is the best available source of statistics on the whole planning profession, however there are issues with using the survey to analyse professional planners, including a relatively small sample size, and a somewhat limited definition of what constitutes a planner (it only includes people who would self-identify ‘town planning officer’ as their main occupation). In order to minimise the chance of reporting erroneous results, we have generated our estimates by taking an average of the estimates for each of the five years to September 2018, rather than using 2018 figures. We have also rounded estimates to the nearest hundred.
RTPI Member Survey 2017 and RTPI membership records
The RTPI holds two main sources of data on its membership.
- Our membership records. All reference to membership records in this report relate to the membership as of January 2019.
- Our 2017 Member Survey. This is reasonably representative of our membership as a whole, thus enabling us to use it to make predictions about the wider membership.
For this report, we filtered both RTPI datasets to limit analysis to groups we believe would be likely to self-identify with ‘Town Planning Officer’ as their main occupation. This mainly involved removing those from outside the UK, those in membership classes we believe to be unlikely to identify as ‘town planning officers’, and for the Member Survey those whose responses indicated they are not currently working in planning.[3] Due to this filtering, estimates derived from RTPI data may vary from estimates published elsewhere.
The EU Labour Force Survey
Published by the EU Commission’s EUROSTAT, this survey collates information from Labour Force Surveys carried out in each EU member state. It provides data on individual states as well as EU totals.
2. The number of planners in the UK
2.1 Summary and key findings
This chapter explores the size of the planning profession and the number of RTPI members currently working in it. We estimate:
- There are around 22,000 planners currently working in the UK.
- About three quarters of planners are RTPI members.
- The planning profession is smaller than other built environment professions.
2.2 The number of planners in the UK
Taking an average of annual estimates from the last five years, the APS estimates there are around 22,000 Planners in the UK. Going back all the way to 2006, 9 out of 13 estimates have been within 10% of 22,000 (see Figure 1). From the Member Survey 2017 we can estimate that 13% of these planners work part time.
This clearly does not represent everyone involved in planning as is obvious from the fact that the RTPI has over 25,000 members. Instead it is the number who would say that ‘Town Planning Officer’ was their main occupation when surveyed. From the analysis for this report we know that this does cover a broad range of planners (e.g. across the public and private sectors). However, clearly this might exclude people deeply connected with planning but working in other fields, for example planning academics and lawyers. Therefore this is only a starting point for assessing the size of the sector.
2.3 Change over time observed in APS data
The APS goes back to 2005 with estimates each year. The margins of error are relatively high for each individual year so any observed trends must be taken with caution. However it is worth noting the apparent dip in England in 2011-12 and rise in 2017-18 (see Figure 1). An obvious hypothesis for the former would be the impact of the financial crisis on development, whilst the latter is perhaps consistent with an increased push towards major new housebuilding.
Figure 1: Number of selected built environment occupations over time
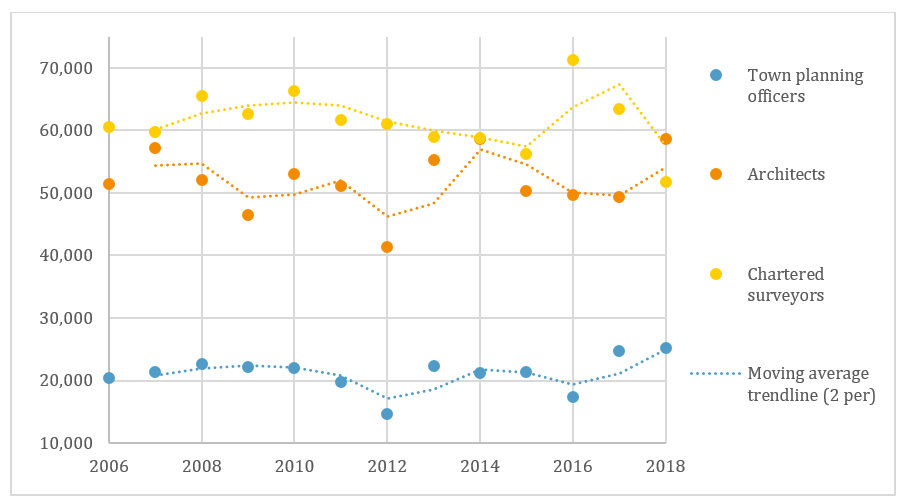
Source: ONS Annual Population Survey filtered by SOC10M codes relating to each built environment occupation. Numbers rounded to nearest thousand. Years refer to year ending September that year. See also Appendix Table 1.
2.4 The number of 'town planning officers' in the RTPI membership
We can’t use RTPI data to estimate the total number of planners in the UK because not all town planners are RTPI members. However, we can estimate the number of RTPI members who would fit into the APS definition of a UK ‘town planning officer’. This is essentially the number of RTPI members who we would expect to report that ‘Town Planning Officer’ is their primary occupation. All the analysis in this report focuses on this sub-group of the membership. This allows comparison with the APS data.
To work this out, we started with the total number of UK-based Chartered, Licentiate, Affiliate and Associate members, and then removed the proportion we do not believe would fit in the town planning officer occupation.[4] The total RTPI membership is over 25,000 – of these about 17,400 are in the classes listed above and based in the UK. We estimate that around 16,200 of these members are also (1) in employment, and (2) likely to see town planning officer as their primary occupation.
Estimated proportion of planners who are RTPI members
Since we have both the total number of planners estimated in the APS (22,000), and a rough estimate of how many RTPI members would fit into this group (16,200), we can make a preliminary estimate of the proportion of town planning officers who are RTPI members. This gives us a rough estimate of around three-quarters (74%) of planners being RTPI members. Put another way, we estimate that around a quarter of practicing planners are not chartered by their professional body.
2.5 Numbers working in other built environment occupations
The APS suggests that the planning profession is relatively small in comparison to other built environment professions, with less than half the number of architects and around a third the number of chartered surveyors[5]. The APS estimates a total of 53,400 architects; 60,300 chartered surveyors; 43,300 quantity surveyors; 73,300 construction project managers and related professionals; and 24,100 architectural and town planning technicians (see Appendix Table 1).
This is worth noting because it highlights the relative resources society directs towards various objectives. Whilst planners, architects and surveyors share many objectives, there appears to be relatively lower resources dedicated to more planning-specific objectives like public participation, plan-making and strategic spatial decision-making. This may be because these are areas where benefits are diffuse and public rather than directed and available for private capture. These are also the areas which have experienced the highest proportion of cuts in public funding in recent years.[6]
We can also observe temporary dips in the total numbers of other built environment professions starting from around 2010 (see Figure 1), mirroring the trend observed for planners.
3. Demographics
3.1 Summary and key findings
This chapter explores the demographics of Planners in the UK. We estimate that:
- Around two-fifths of planners are women and three-fifths of planners are men, compared to close to half-half in the general working population.
- The most common age group for planners is 35 to 44 (just under a third of the total). The APS estimates that around a third are under 35 and just over a third over 45. If this is correct the RTPI membership is slightly older than the profession as a whole.
- The planning profession has a higher proportion of women and under 40s than other built environment professions and a lower proportion of BAME individuals.
3.2 Gender
The APS estimates that 41% of UK planners are women (around 9,000) and 59% are men (around 13,000). The split between male and female estimated in the APS data is very similar to the ‘UK town planning officer’ groups from our member data, (41% women, 59% men), and the RTPI Member Survey 2017 (40% women, 60% men). There remains a slightly higher proportion of male planners (59%) than the average for all occupations in the wider economy (53%). There appears to be a greater proportion of women in the public sector than the private sector (see 5.2).
We can also look at change over time in the APS data on the gender of planners (Figure 2). As elsewhere, this should be taken with care given margins of error, however a few trends may be worth further exploration. First, it seems that the proportion of female planners has not risen in the last decade. Second, the APS estimates that the proportion of women in the profession dropped from 2009-12. While this cannot be confirmed by the data, one hypothesis would be that female planners were affected by the financial crisis earlier and to a greater extent than male planners.
Figure 2: Proportion of each built environment profession who are women over time
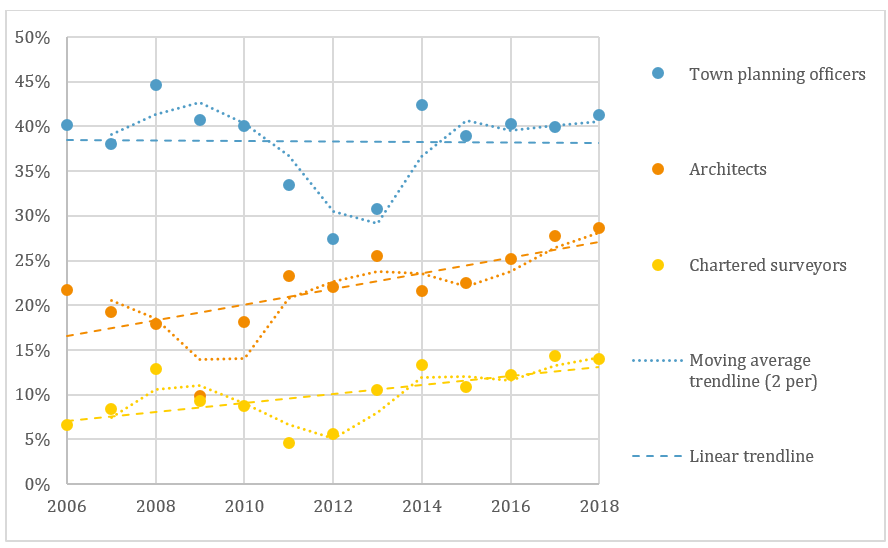
Source: ONS Annual Population Survey, filtered by SOC10M for selected built environment occupations.
3.3 Age
Figure 3 shows data from the RTPI Member Survey, RTPI membership records, and the APS on the age profile of planners. In each dataset the largest group is those aged 35 to 44 (just under a third), with between a fifth and a quarter each for the age bands 25-34 and 45-54 (see Figure 3). If the APS estimates are correct, the RTPI Membership is slightly older than that profession as a whole, with a lower proportion of under-35 year olds and a higher proportion of over-45 year olds.
Figure 3: Estimates of proportion of planners in each age group from APS and RTPI data
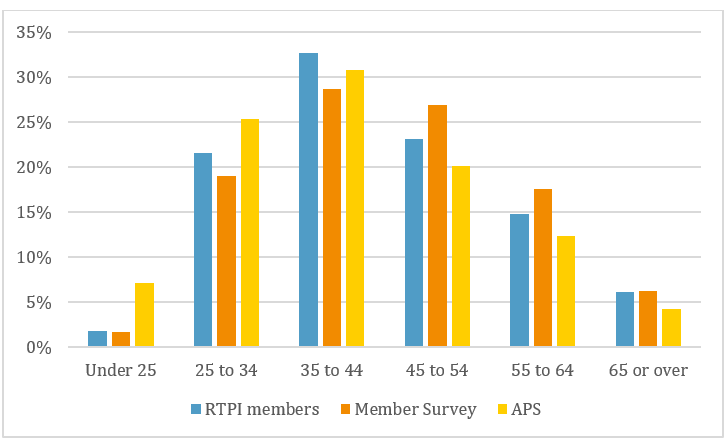
Sources: RTPI Membership data Jan 2019 filtered by planner groups. RTPI Member Survey 2017 filtered by planner groups. ONS Annual Population Survey, filtered by SOC10M = 2432 (Planners). See also Appendix Table 5.
3.4 Ethnicity and nationality
The RTPI membership as a whole is roughly 7% BAME individuals, however all our data sources estimate the proportion of BAME individuals working in town planning in the UK at around 3-4%. If we filter our member data for the UK town planning officer group, we are left with 96% white, and 4% BAME. For the RTPI Member Survey 2017, respondents in the UK town planning officer group identified as 97% White, with 3% BAME. The APS estimates that 3% of UK planners are from BAME ethnic groups, though this estimate varies greatly each year given small sample size.
If correct, this suggests a lower proportion of BAME individuals in planning (3-4%) than the average for all occupations in the wider economy (12%).
From the APS, we can estimate that 94% of planners in the UK hold UK nationality, with 4% EU and 2% the rest of the world.
3.5 Comparison with other built environment professions
According to the APS data there is a far higher proportion of female planners than in other built environment professions. Taking five-year averages, the APS estimates that 41% of planners are women compared to 25% of architects, and 13% of chartered surveyors. However, whilst the proportion of female planners appears around the same as a decade ago, the proportions of female architects and surveyors appear to be rising (see Figure 2). [7]
In terms of age we see quite a large amount of variety between the professions in the APS data. The APS estimates that over half of planners are under the age of 40, compared to around two-fifths of architects and chartered surveyors.[8]
Finally for ethnicity, there appears to be a lower proportion of BAME Planners (3-4%) than some other built environment professions. Taking 5 year averages, the APS estimates 9% of architects and 4% of chartered surveyors are BAME individuals.[9]
4. National and regional breakdown
4.1 Summary and key findings
This chapter explores the national and regional split of planners in the UK. Using APS and RTPI data, we estimate that:
- The geographic distribution of the planning profession is similar to the overall distribution of the working population.
- There are around 18,300 planners in England, 2000 in Scotland, 1000 in Wales, and 600 in Northern Ireland.
4.2 National and regional breakdown
All of our data sources tell a similar story about the distribution of planners – in short that it roughly matches the distribution of the general working population (see Table 1 below).
Proportions of planners in each nation and region
The APS does not produce reliable estimates for the number of planners in every nation and English region due to small sample sizes. However, what is probably more reliable is the estimates that 84% of planners work in England with 16% in the rest of the UK. The APS also estimate of the overall working population in the UK, suggests a similar split (85% and 15%). Finally, the APS estimates a similar national breakdown for other built environment professions, with around 85% in England and 15% in the rest of the UK.
Both RTPI membership data and the RTPI Member Survey 2017 tell a similar story of the national picture. They also allow us to provide estimates of the full national and regional breakdown. RTPI membership data shows that of our ‘UK town planning officer’ group, 83% are in England, 9% in Scotland, 5% in Wales, and 3% in Northern Ireland. The South East has by far the most members in England (18% of the UK total), followed by London (13%) and the South West (11%). The rest of English regions have between 3% and 9% each. See Table 1 below for a full breakdown.
Number of planners in each nation and region
Combining the overall number of planners estimated by the APS with the regional and national breakdown from the RTPI membership records allows us to estimate the number of planners in each region and nation. Taking this approach and rounding to the nearest hundred this would mean 18,300 planners in England, 2,000 in Scotland, 1,000 in Wales, and 600 in Northern Ireland. Taking the same approach to English regions, would estimate the North East to have the smallest number of planners (around 700), whilst the South East would have the most (around 3,900).
Table 1: Estimated proportion and number of planners from each nation and region across RTPI and APS data
|
|
RTPI members1 |
RTPI Member Survey2 |
APS town planning officers3 |
APS general population4 |
Estimated number of planners5 |
|
Nation |
Estimated % in each population group |
Estimated n |
|||
|
England |
83% |
83% |
84% |
85% |
18300 |
|
Wales |
5% |
5% |
5% |
4% |
1000 |
|
Scotland |
9% |
10% |
6% |
8% |
2000 |
|
Northern Ireland |
3% |
2% |
6% |
3% |
600 |
|
Total |
100% |
100% |
100% |
100% |
22000 |
|
English region (% of whole UK) |
|
|
|
|
|
|
North East |
3% |
3% |
6% |
4% |
700 |
|
North West |
10% |
9% |
9% |
11% |
2200 |
|
Yorkshire and The Humber |
6% |
5% |
4% |
8% |
1200 |
|
East Midlands |
6% |
6% |
7% |
7% |
1300 |
|
West Midlands |
7% |
8% |
7% |
8% |
1600 |
|
East of England |
9% |
9% |
9% |
10% |
2100 |
|
London |
13% |
13% |
16% |
14% |
2800 |
|
South East |
18% |
16% |
17% |
14% |
3900 |
|
South West |
11% |
12% |
8% |
9% |
2500 |
|
Total |
83% |
83% |
84% |
85% |
18300 |
Sources: (1) RTPI Member data filtered by 'UK town planning officer' group, (2) RTPI Member Survey 2017 filtered by 'UK town planning officer' Group, (3) ONS Annual Population Survey filtered by SOC10M 2432: Town Planning Officers - figures based on average of 5 years to September 2018 and rounded to nearest hundred, (4) ONS Annual Population Survey, (5) Estimates derived from estimated number of planners in APS and % in each nation from RTPI membership records and rounded to nearest hundred.
Whilst data quality issues could lie behind some of the differences, a few observations may be worth exploring further. First, all three planner-focused datasets estimate that the number of planners working in the Yorkshire region are low relative to the overall numbers of people working there, whilst the number working in London and South East is higher than the overall numbers working there. Second, there appear to be more RTPI members working in the South West of England than would be expected given APS estimates of the overall number of people and planners working there.
However, given that all of our data sources are broadly the same here, in general it looks like the overall distribution of planners likely matches the overall population distribution.
5. Who are planners employed by?
5.1 Summary and key findings
This chapter explores the employers of planners in the UK. We estimate that:
- Between 11-13% of planners are self-employed.
- About 44% of planners work primarily in the private sector compared to 56% in the public sector, with an apparent trend towards a greater proportion of planners employed in the private sector in recent years.
- Planners are more likely to have at least one public sector employer in Scotland (73%), Wales (72%) and Northern Ireland (76%) than in England (58%).
- There are around 11,400 planners in the UK at least partially employed by local planning authorities, with about 10,500 only working for local planning authorities.
- Amongst wider built environment occupations planners are amongst the least likely to be self-employed, and are the most likely to be employed in the public sector.
5.2 Employers of planners
Both the APS and RTPI Member Survey 2017 have information on the type of employer, including sector and self-employment.
Public and private sectors
The RTPI Member Survey 2017 asked respondents who were currently working to list their type of employer or employers. 59% of the UK town planning officer group had at least one public sector employer, 42% at least one private sector employer (including the self-employed), and 7% at least one third sector employer.[10]
To compare with the APS data we need to estimate what the sectoral breakdown would be in terms of primary employer based on the Member Survey data. And we need to group private and third sector employers into one category (the APS records them both as ‘private). To estimate the proportions according to primary employer, we can break down the responses further.[11] Assuming that members employed in both public and private sectors would be equally likely to list each as their primary employers, we estimate that 57% of RTPI members are employed primarily in the public sector, and 43% in the private sector (including the third sector). This is very similar to the estimate in the APS, which estimates that 56% work in the public sector (around 12,300 planners) and 44% work in the private sector (around 9,700 planners).
Whilst there are some anomalous results, in the APS data it appears there is a trend of the public sector shrinking and the private sector growing since around 2009-10 (see Figure 4). Since there is no equivalent decline in the total number of planners over that period it appears most likely that this represents a transfer of planners from the public to private sectors.
Figure 4: Proportion of planners in public and private sectors over time
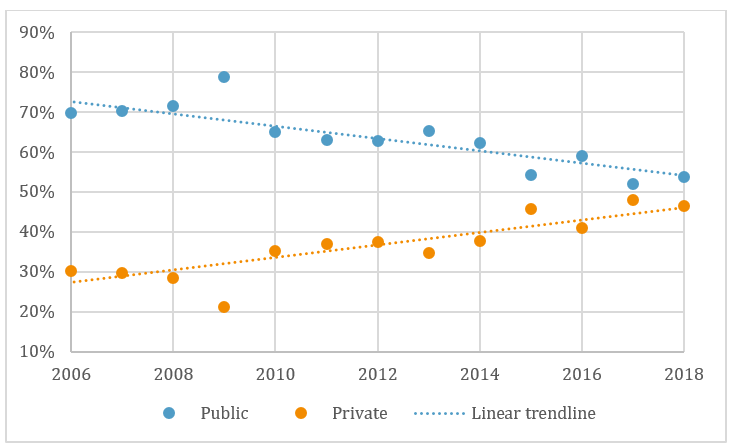
Source: ONS Annual Population Survey, filtered by SOC10M = 2432 (Planners). Result for each year is based on period ending September that year.
Female planners appear to be slightly more likely to work in the public sector though the data is variable. There is little difference in the APS estimates with women making up about 39% of the private sector and 42% of the public sector. However, if we use the Member Survey 2017 to look at who are at least partially employed in either sector there is a bigger difference. 45% of the group at least partially employed in the public sector were women compared to 35% in the private sector.
Finally, the RTPI Member Survey data suggests that the proportion of planners at least partially employed in the public sector is higher in Scotland (71%), Wales (71%) and Northern Ireland (76%) than in England (59%). This may relate to the increasing disparity between the planning systems in the different nations post-devolution. However, the Member Survey also suggests there is variation within England, with less than half of planners working in London and the North West at least partially employed in the public sector, compared to closer to three-fifths in most other parts of England, rising to seven out of 10 in the East Midlands.[12] Again, this must be taken with caution due to relatively small sample size and the fact that this is RTPI members working in UK town planning rather than all planners.
Self-employed Planners
The APS data estimates that 87% of planners (around 19,100) have an employer compared to 13% who are self-employed (around 2,900). This is similar to the 11% self-employed estimated for the UK town planning officer group in the RTPI Member Survey.
Other detail on employer type
The Membership Survey also asked for more detailed information on employers (see Figure 5).[13] It found the following proportions of members were at least partially employed by:
- Public sector: local government (52%); central government (5%); and national agencies (4%). It also suggests around 88% of RTPI members at least partially employed in the public sector work in local authorities.
- Private sector: national consultancies (14%); self-employed (11%); regional and local consultancies (8%); development companies (7%); house builders (6%); architectural and design practices (5%); and international consultancies (4%).
Figure 5: Most common employers of planners in UK
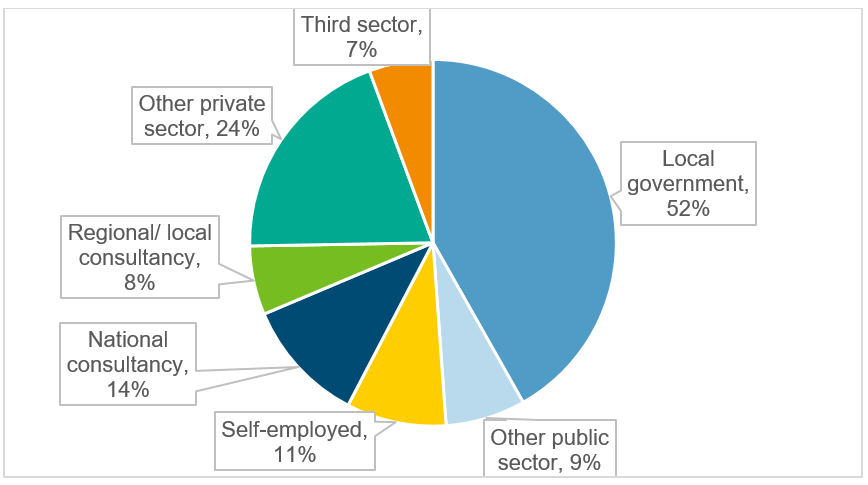
Source: RTPI Member Survey 2017 filtered by 'UK town planning officer' Group. Values refer to proportion of respondents at least partially employed by each employer. Respondents may have more than one employer so percentages do not equal 100.
Likely number of local authority planners
Based on combining the Member Survey data on employer type and the APS data on total number of planners, we estimate that there are around 11,400 planners employed at least partially in local authorities in the UK, with around 9,200 of them working in England.
RTPI members and the wider planning profession
Given we have figures on the overall population of planners and data on RTPI members, we can estimate the likelihood of certain subsectors of planners being RTPI members. Based on the data we have it appears that the RTPI membership is closely representative of the profession as a whole in terms of type of employer. Accordingly, we can estimate where planners without the RTPI’s professional accreditation (‘missing members’) are located. We estimate that there are around 3,100 missing members primarily employed in the public sector (including around 2800 primarily employed in local authorities). We estimate there are around 2,700 missing members primarily employed in the private and third sectors combined. Of course, these estimates are dependent on the accuracy of the estimates from the APS and the RTPI Member Survey.
5.3 Comparison with other built environment professions
The APS also records the public/ private and employed/ self-employed splits for other building environment professions.[14] Taking 5 year averages, the APS estimates that about 3% of architects and 13% of chartered surveyors are employed in the public sector. The tiny proportion of architects employed in the public sector is particularly interesting given that 50% were employed in the public sector as recently as 1976.[15] This is more dramatic than the shift from public to private sector in the planning profession. However, it indicates how much things can change. The APS also predicts that in this category of built environment professionals, planners are amongst the least likely to be self-employed (13%), with architects the most likely (37%).[16]
6. Built environment professions in the EU
6.1 Summary and key findings
In this chapter we use European Labour Force Survey data to compare built environment professionals across the EU. We estimate that:
- There are around 87,000 planners in the EU of which two-thirds are in just three countries (the UK, Germany, and the Netherlands).
- The distributions of professionals between planning, architecture and surveying varies greatly across the EU. Overall, about two-thirds are architects, with a fifth surveyors and a tenth planners. This means the UK has relatively more planners and surveyors and relatively less architects.
- A higher proportion of UK planners are women compared to the EU average, but the opposite is true for architects and surveyors.
6.2 The number of planners in the EU
Countries across the EU conduct versions of the Labour Force Survey (LFS) and this data is collected centrally by EUROSTAT. This means we are able to compare the size and structure of the built environment professions across Europe. Using this data we estimate that there are around 87,000 planners in the EU, of which over two-thirds are in just three countries (the UK, Germany, and the Netherlands).
Although the data has limitations, by comparing the relative number of planners, architects, and surveyors we can clearly see that the built environment professions are structured very differently in different countries (see Figure 6). The EU average is for about two-thirds of professionals to be architects, with a fifth surveyors and a tenth planners. The proportion of planners goes as low as 5% in France, and as high as 45% in the Netherlands (it is 16% in the UK). For architects it is a low of 40% (in the UK) and a high of 80% (in Germany). Finally, the proportion of surveyors ranges from 8% in Germany to 44% in the UK. The UK is unique in surveying being the largest of the three professions, with more than double the EU average proportion.
In the Netherlands there is roughly one planner for every 1000 people, compared to one planner per 3000 in the UK. Sweden and Germany have similar proportions of planners per person, while France has a far smaller proportion. Finally, Germany is notable in having almost three times the number of architects as the UK.
Figure 6: Built environment professions across the EU
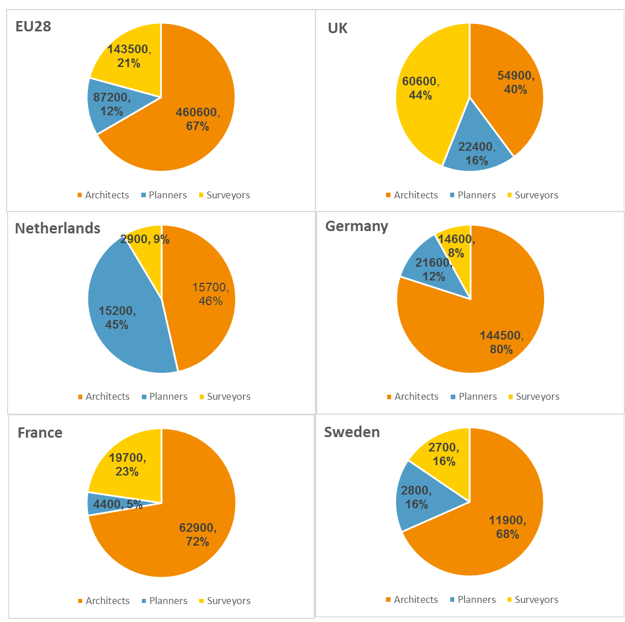
Source: EUROSTAT European Labour Force Survey filtered for ISCO 4 digit occupational codes for selected built environment occupations. Values are five year averages.
The data does not explain these variations, however there are several possible explanations. It may be that the boundaries of each profession may vary between countries, for example architects in one country adopting roles that planners play in another. The population density, land market, and policy environment of each country may play a role. And some countries may simply value investment in the built environment more than others.
6.3 Gender of built environment professionals in the EU
Taking the EU average, architecture and planning have roughly the same proportion of women (37%), both much higher than surveying (21%). In the UK, there is a higher proportion of female planners (42%) than the EU average (37%), while both architecture (24%) and surveying (15%) have a lower proportion of women than the EU averages (38% and 21%).[17]
There is great variation between individual countries. The APS estimates that two-thirds of planners in France are women, compared to a quarter in the Netherlands. Sweden is interesting in that half of those working in each of planning, surveying, and architecture are women.
7. Conclusions and next steps
The analysis reported here is only a first step towards understanding the size and makeup of the profession. One of the major goals of this research was to identify information gaps so future research can help develop a more nuanced picture. This chapter considers what we have learned in this report, as well as some of the gaps and our plans to fill them.
7.1 How confident can we be about these findings?
There is correlation across all three of the UK datasets on a range of estimates on planners including demographics, geographic distribution, and employer type. This is not proof in itself of the accuracy of these data in describing the profession, however, it does give us some confidence regarding the findings in those areas at least. This also suggests that RTPI members working in UK planning are likely to be representative of the wider sector.
The other estimates in this report are the best we can produce given the data we have available. This means they should be treated with caution, however they remain useful as the best available estimates, and as a baseline against which to test future data collection. This includes the estimate of the total number of planners as well as all estimates of various sub-groups derived from that. The estimates produced in this report will provide a baseline and can be tested by future work. There is a fuller discussion of methodology and limitations in the technical report, available at www.rtpi.org.uk/planningprofession.
We are undergoing a process of improving our membership data and we will be conducting further membership surveys in the coming years. If you are aware of additional data we have not yet considered please email [email protected].
7.2 Refining estimates of the size and makeup of the profession
The definition of a planner
To facilitate comparison with the APS we chose to focus all our analysis on a subgroup of the profession who we believe would be likely to self-identify with ‘planner’ as their main and current occupation. This clearly excludes both planners who are not currently working, and some planners who don’t feel this to be their main occupation. It is certainly a limited conception of the profession, however we believe it is a reasonable starting point. In future research we intend to interrogate this in more detail, and to paint a picture of the 21st century planning profession in all its diversity.
Developing more nuanced and robust estimates
The first step will be to identify segments of the profession for which we can secure robust estimates. Given that we believe the majority of planners to be employed in either local authorities or consultancies, this means that securing estimates for these populations will get us most of the way there. Some data already exists for this, for example the Scottish Planning Performance Framework (which counts planners at local authorities in Scotland) and Planning Resource Magazine’s Planning Consultancy Survey[18]. We may also be able to collect data on other sectors. Even where data does not exist, we may be able to investigate individual case study areas or organisations to help us to test the estimates of the APS.
7.3 Assessing the adequacy of the current size of the sector
This data does not tell us about the adequacy of the current size of the planning sector and its distribution. Major cuts in recent years have had a big impact on local planning authorities, as evidenced by the drop in planners working for the public sector shown in this report and Investing in Delivery[19], and also qualitatively in Serving the Public Interest[20]. The National Audit Office also recently cited the resourcing of planning as a major barrier to delivering housing.[21]
Research from the Ministry for Housing, Communities and Local Government (MHCLG) and the Planning Advisory Service (PAS) is underway to explore skills and resourcing gaps in local authorities. We hope to build on this and our other research, with further data collection around the UK to answer this question. We also have research planned on the pipeline into the planning profession, to understand how to secure the next generation of planners. We will also be developing a position paper on how planning should be resourced, drawing on evidence of the current level of resourcing and cuts since 2009-10.
7.4 The future of the profession
As discussed above, we have taken a fairly limited conception of what constitutes a planner in this report so as to enable analysis with the available data. However, even more importantly this report has not begun to consider the future of the planning profession. The typical roles and even employers of planners in the future may be radically different from what they are at the moment. The boundaries of built environment occupations may be fluid – as is suggested by the variation seen across Europe in Chapter 6. We also hope to collect information on non-traditional places and jobs planners are working and to anticipate what the profession might look like in the future. We want RTPI to represent the whole of the planning profession, wherever and however it exists.
[1] See further discussion on each dataset and the filtering process below and in the technical report,
[2] ONS, SOC2010 Classification, Main Job.
[3] See further discussion the filtering process in the technical report.
[4] We can estimate the proportion of each class currently working as Town Planning Officers using the Member Survey data, which includes information on employment status and employer (see technical report for more details).
[5] The Annual Population Survey occupation ‘Chartered Surveyor’ appears to refer to land and building surveyors (as opposed to quantity surveyors).
[6] The RTPI is currently developing a position paper on resourcing which evidences these cuts.
[7] This data can also be viewed in Appendix Table 4.
[8] A full breakdown for each occupation is available in Appendix Table 6.
[9] A full breakdown for each occupation is available in Appendix Table 8.
[10] These findings were reported in January 2018 edition of The Planner, ‘Insight: The RTPI Member Survey 2017'. The numbers in that analysis may be slightly different as the analysis in this report considers a slightly different group so as to enable comparability with the APS.
[11] The full figures and working for this can be seen in Appendix Table 13.
[12] Figures for each region and nation are available in Appendix Table 17.
[13] The full breakdown of employer types can be found in Appendix Table 12.
[14] The full data on public/ private splits for each occupation is available in Appendix Table 14.
[15] RIBA Building Futures, The Future for Architects?, 2011
[16] Full data on proportion of self-employed in each occupation can be found in Appendix Table 18.
[17] Full data on the gender of planners in the EU can be found in Appendix Table 20.
[18] Planning Resource (2018), The Planning Consultancy Survey 2018.
[19] RTPI (2015, 2018), Investing in Delivery
[20] Slade, Gunn and Schoneboom (2018), Serving the Public Interest, RTPI and Working in the Public Interest
[21] National Audit Office (2019), Planning for New Homes.


