 RTPI Scotland has published an updated analysis of resourcing within Scottish planning services. To read a summary of the findings as an infographic, click here.
Updates from previous years are linked below:
Resourcing the Planning Service: Key Trends and Findings 2022
Resourcing the Planning Service: Key Trends and Findings 2021
Resourcing the Planning System: Key Trends and Findings 2019
*Please note that there was no published report for the year of 2020*
You can read the findings in full below or download the report here.
Context
The purpose of this research is to inform discussion and decision making on the resourcing of the planning system within Scotland. It intends to provide context for MSPs, local authorities, and other relevant stakeholders within the wider scope of the built environment.
Planning has a vital role to play in moving towards a sustainable, resilient, and inclusive recovery from the COVID-19 pandemic and response to the climate and nature emergencies through accelerating progress to a zero-carbon economy, increasing resilience to risk, and through creating fair, healthy and prosperous communities. [1]
The planning system facilitates economic growth and innovation by bringing together people, activities, and resources [2]. Limited resources and ambition for planning to deliver quality outcomes can create a vicious cycle of low-quality development and reduced confidence in the planning system and local authorities.
In the past 15 years, planning services in Scotland have experienced an increasing reduction in resourcing, greatly impacting the capabilities of the service. This has coincided with an increase in the number of unfunded duties to local authorities, creating an unsustainable position that has the potential to impact performance, staff retention and satisfaction, statutory targets, community trust in planning, and economic development.
Key Findings
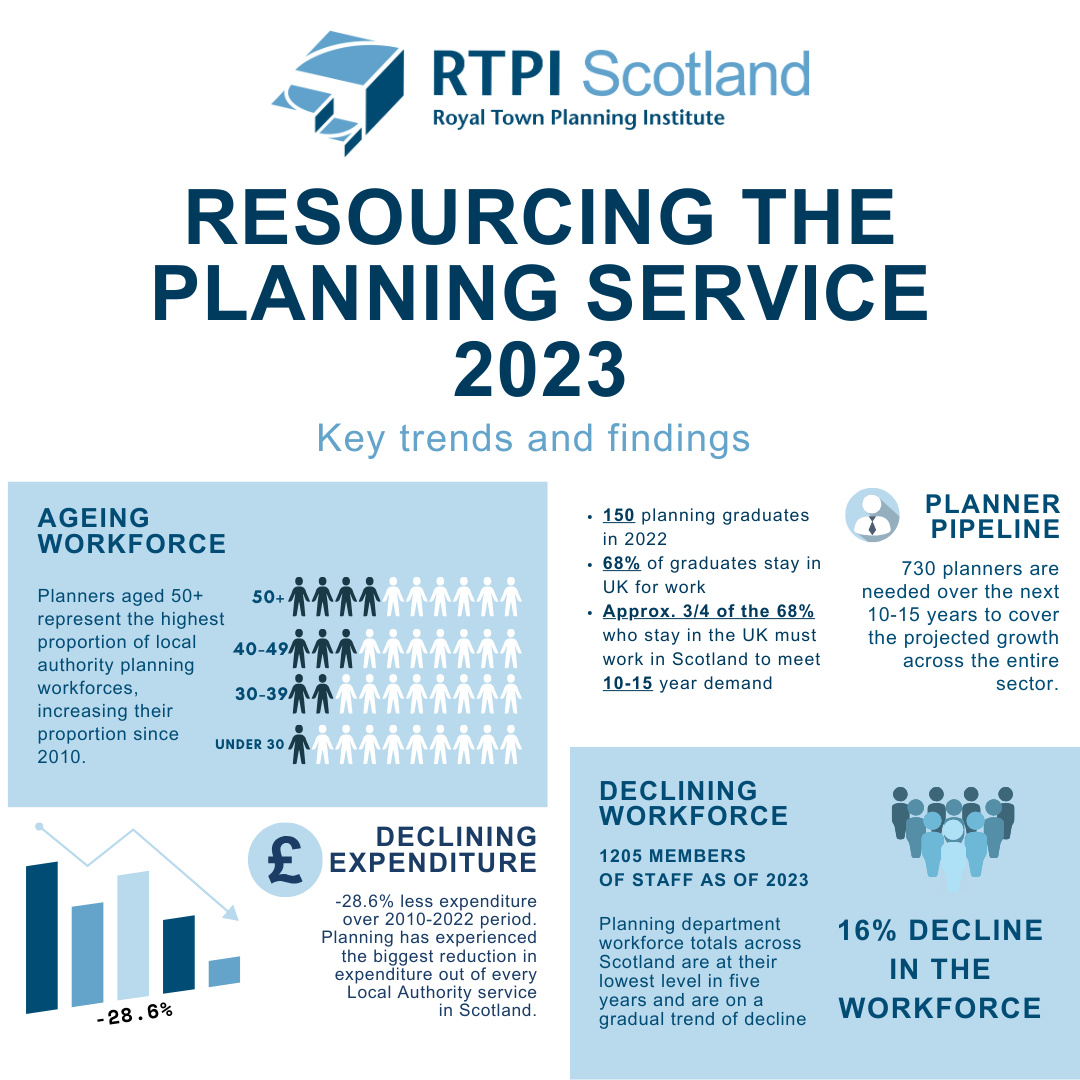
- Planning expenditure is still falling, with a -28.6% drop since 2010-11, leaving it as the most reduced and lowest funded local authority department on a national scale. The change from 2020/21 to 2021/22 was -2.4% at a national scale, while all other services increased to some degree.
- Workforce is at the lowest level in five years at 1205 members of staff in local authorities as of 2022/23. The previous year’s level was at 1242.
- RTPI Scotland’s 2022 update reported that the Planning (Scotland) Act 2019 has introduced 49 unfunded duties on local authorities. The Scottish Government’s roll out of this legislation risks planners (and the planning system) being immediately placed on the back foot in terms of delivering on these duties without a robust resourcing and upskilling strategy in place.
- The planning workforce continues to age, and employees 50+ now represent 39.6% of the total.
- The shift to digital continues to progress, promoting an innovative and efficient planning system.
- Planning fees were increased in April 2022, seeking to provide cost-recovery on applications that previously required a low-fee or no fee at all. Further research is required to assess the impact of increased fees on the planning service. However, HOPS has previously commented that this change is an interim solution, and the increase, particularly to residential fees (residential being the most common development type by a significant margin) is insufficient when adjusted for inflation. [6]
- Based on past statistics and current trends, there appear to be too few planners entering the sector through higher education to meet replacement demands.
Given this, if we want to ensure that the planning system meets its fullest potential, there is a need to:
- Re-invest in planning services and raise planning to a higher priority in budgetary decision making.
- Ensure that services are operating with an optimum level of staff with the required skillset.
- Provide appropriate resourcing to allow for services to effectively undertake new duties introduced in legislation.
- Ensure that we are supporting education and local authorities in a way that presents planning as an attractive option for younger entrants into the field, including through the development of alternative entry routes into the profession.
- Continue to support the development of digital methods and promote their adoption within the planning service.
- Analyse the way in which the recent fee changes have impacted services and assess where the shortfalls remain and how this can be solved.
Budgets
Planning services continue to be disproportionately impacted due to budget cuts.
At the national scale, planning is the most underfunded department across all local authorities, the department that has experienced the highest decrease in funding, and the only department to see a net decrease in expenditure from 2020-21 to 2021-22.

Figure 1 - Change in Expenditure since Previous Year 2021-22, Improvement Service (2023)
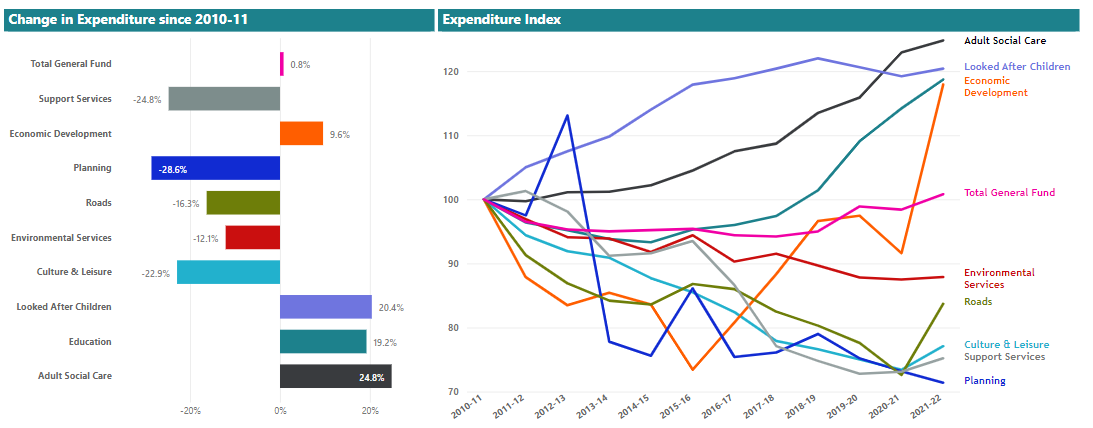
Figure 2 - Change in Expenditure since 2010-11, Improvement Service (2023)
Since 2010-11, planning has seen its expenditure decrease on a national level by -28.6%, the largest decrease across all local government departments. This is not only a disproportionate decrease, but also represents a stark contrast to the levels of 2012-13, when planning received the most expenditure out of every department. In addition, planning was the only department to experience a net decrease in expenditure between 2020-21 and 2021-22 of -2.4%. This decrease in expenditure is not indicative of a reduced need for planners. On the contrary, The Planning (Scotland) Act, Short-Term Let regulations, and the proposed Human Rights Bill for Scotland demonstrate a need for planners more than ever.
Available data for the City of Edinburgh Council and Glasgow City Council, two of the busiest and largest (in population) local authorities, suggest decreases in their planning expenditure since 2010-11, well above the national trends (-52.9% at Edinburgh and -43.2% at Glasgow).
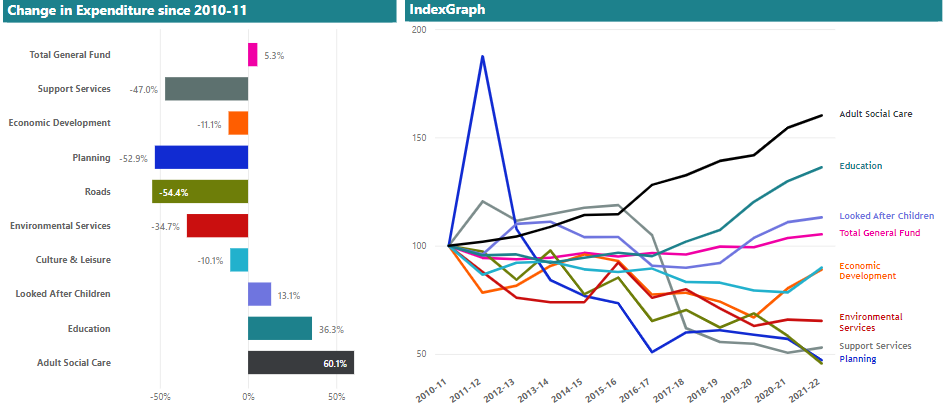
Figure 3 - Edinburgh specific expenditure, Improvement Service (2023)
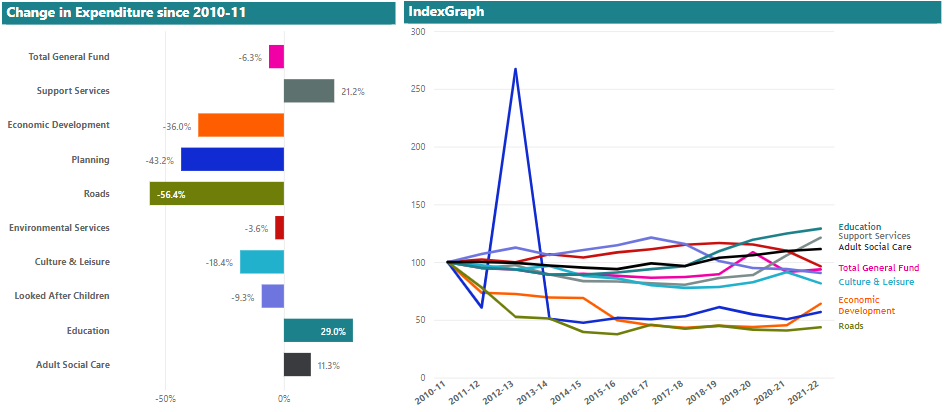
Figure 4 - Glasgow specific expenditure, Improvement Service (2023)
Income
Fees have increased, though it is yet unclear if this has had a sufficient impact on cost recovery for planning authorities.
As identified in the 2022 report, only 66% of processing costs of applications were covered by planning application fees[5]. A position statement released by HOPS in 2021 on the proposed fee increase reported that the fees only covered 42.7% of the development management service and 32.9% of the running of the entire service. [6]
Town and Country Planning (Fees for applications) (Scotland) Regulations came into enforcement on the 1st of April 2022. This increased and redefined the fee expectations for different types of applications within Scotland. Though this may have brought in some additional income for the service, HOPS have taken the view that this increase represents an interim solution that does not provide long-term solutions for achieving an appropriate cost-recovery. [6]
There is not yet appropriate data available to assess the impact of the fee increase on the planning service.
HOPS have previously identified that over a 10-year period fees remained relatively static, with no annual inflationary increase. As a result, when adjusted for inflation, the increase in fees may not have had a significant impact on cost-recovery. Housing and householder development constituted a large majority of national applications for 2022/23 and in previous years. Using these application-types as an example, the below table demonstrates that the impact of the fee increase in real terms, when adjusted for inflation, did not result in a significant increase in the real term fees generated by these applications.
Residential examples
|
Development Type |
Previous Fees from 20141 |
Fees since April 1st 20222 |
2014 Fee adjusted for inflation3 |
Real terms change adjusted with inflation |
|
Residential -Single Dwelling |
401 |
600 |
529.52 |
13.31% |
|
Residential – 25 Units |
10,025 |
12,750 |
13,237.99 |
-3.68% |
|
Residential – 150 Units |
40,050 |
48,800 |
52,885.95 |
-7.73% |
|
Residential – Householder (one existing dwelling) |
202 |
300 |
266.74 |
12.46% |
1 Planning Fees from 2014 sourced from Montagu Evans (2022)[7]
2 Planning Fees from 2022 calculated using eDevelopment.scot publication (2022) [8]
3 Inflation rate calculated using Bank of England Inflation Calculator [9]
It is acknowledged that this analysis alone does not provide a whole picture of the impact of the April 2022 planning fees increase on the planning service. It does, however, give an indication that more work is required to achieve full cost-recovery.
HOPS are currently looking into resourcing issues, including recruitment, retention, and the impact of the fee increase.
Workforce
Workforce numbers are on a steady decline with not enough new entrants into the public sector.
Data provided on workforce presents concerning trends for the future of planning services. The provided dataset for this information comes directly from the Improvement Service and is based on a 5-year period from 2018 to 2023.
Data Limitations
From 2019/2020 the data is somewhat limited due to the following:
- 2022/23 - No age breakdown for South Lanarkshire (44 staff in total), no data for Inverclyde or Shetland.
- 2021/22 - No age breakdown for South Lanarkshire (40 staff in total), no data for Clackmannanshire.
- 2020/21 - No data for Clackmannanshire.
- 2019/20 - No data for Clackmannanshire, Dundee City, Highland or Shetland.
To account for this, we have extrapolated the missing data for each local authority area, as follows:
- For Clackmannanshire in 2019/2020, 2020/2021 and 2021/2022 – taking an average of the data for 2018/2019 and 2022/2023.
- For Dundee City, Highland, and Shetland in 2019/2020 – taking an average of the data for 2018/2019 and 2020/2021.
- For Inverclyde and Shetland in 2022/2023 – applying the assumption that the staffing level remained the same as 2021/2022.
For the purpose of this report, we have based our findings on the total national workforce figures including the extrapolated data.
Figure 6 includes a graph of the total national workforce by year, which shows the staff figures both excluding and including the missing data.
While authorities do provide data on RTPI chartered planners, the data used for this update covers the planning service workforce and may include employees who do allied tasks, e.g. technicians, but are not chartered planners.
Total Workforce
For the period of 2018/19, the total national workforce in local authority planning departments was 1332 people. In 2019/2020, this number fell to 1283.
After this point, there is a clear decline in workforce numbers each year from 2020/21, with the data as of October 2023 presenting the total workforce of 2022/23 to be 1205, a drop of 127 from 2018/19 and the lowest recorded number out of the dataset. This is a 9.5% drop in staff over the five-year period, and a 16.3% drop in staff since 2014/2015 (when the total planning workforce figure was recorded as 1440).
Age Profile of National Workforce
The 50+ demographic continues to be the predominant cohort of planning service staff, with data in 2022/23 indicating that 39.6% of the workforce are in this demographic. The 40-49 cohort has remained consistent since 2018/19, indicating that staff retention appears to be strongest among older members of the workforce.

Figure 5 - Planning Staff Age Profiles, (HOPS, RTPI Scotland, Improvement Service, 2022)


Figure 6 - Five-Year summary of National Workforce, (Improvement Service, 2023)
Planners under 30 have mainly constituted an average of 9.32% of workforce over the past five years, with a distinct drop to 8.1% in 2020/21 and a notable rise to 10.5% in 2022/23. Planners who are 30-39 have seen their most notable reduction for 2022/23, dropping to a level of 22.2% from 25.8% in 2018/19.
The above is consistent with data from the Future Planners Project Report which indicates that staff aged 50+ have gradually overtaken the 30-39 and 40-49 demographic to become the most prominent demographic from 2013/14 to 2020/21 [10]. This has coincided with a steady overall decrease in the under 30s demographic.
Projections from this report implied that the 50 and over demographic would continue to grow, which has been reflected in the data for 2018-2023.
Conclusions
A demographic predicament is being created within the planning service across Scotland; with an increasing risk that as the predominant 50+ demographic approaches retirement, there will be insufficient entries into the sector to replace them. Though the concerns associated with an ageing workforce is replicated on a national level, planning is acutely at risk because of the additional trend of falling expenditure.
Though experienced and long-standing members of the workforce are invaluable assets to planning services, it is important that there is greater recruitment, retention, and training of younger members of staff to ensure workforce continuity in local authority planning departments. Additionally, a more equitable demographic profile would provide greater support and opportunity for younger planners looking to enter the profession.
The data implies that younger staff are seeking employment outside local authorities once they have gained further experience in the sector. This was previously identified in the Future Planners Project Report.[10]
Education
Current trends suggest that the replacement rate of planners through education is inadequate to address demographic concerns.
Data from the RTPI reveals that there were approximately 150 planning graduates from RTPI accredited degrees in Scotland in 2022. The Future Planners Project Report estimates that over the next 10-15 years, approximately 550-600 planners will be needed to meet replacement demand across the entire planning sector due to retirements, and an additional 130 planners to cover the projected 11% growth in areas of the sector up to 2030, bringing the total to 680-730 planners needed over the next 10-15 years.
Despite the number of graduate planners providing an adequate replacement rate in theory, a proportion of those graduate planners will work outside Scotland. This pattern is affected by multiple factors, including students returning ‘home’ to work – whether that’s to England, Wales, or other parts of the world; the graduate job market having a strong London/south bias; and visa rules which make it difficult for international students to remain and work in the UK following graduation.
The table below demonstrates the number of new planners that could be added to Scotland’s planning workforce at various retention rates (45%, 50%, 68% and 100%). This assumes that the 2022 figure of 150 graduates can be applied in future years, and notes the research undertaken by Partners in Planning (2021) which indicates that between 2012/13 and 2016/17, around 68% of planning graduates in Scotland went into UK work although we do not know what proportion remained in Scotland. [11]
|
Year |
Retention |
45% |
50% |
68% |
100% |
|
2023 |
67 |
75 |
102 |
150 |
|
|
2024 |
135 |
150 |
204 |
300 |
|
|
2025 |
202 |
225 |
306 |
450 |
|
|
2026 |
270 |
300 |
408 |
600 |
|
|
2027 |
337 |
375 |
510 |
750 |
|
|
2028 |
405 |
450 |
612 |
900 |
|
|
2029 |
472 |
525 |
714 |
1050 |
|
|
2030 |
540 |
600 |
816 |
1200 |
|
|
2031 |
607 |
675 |
918 |
1350 |
|
|
2032 |
675 |
750 |
1020 |
1500 |
|
|
2033 |
742 |
825 |
1122 |
1650 |
|
|
2034 |
810 |
900 |
1224 |
1800 |
|
|
2035 |
877 |
975 |
1326 |
1950 |
|
|
2036 |
945 |
1050 |
1428 |
2100 |
|
|
2037 |
1012 |
1125 |
1530 |
2250 |
|
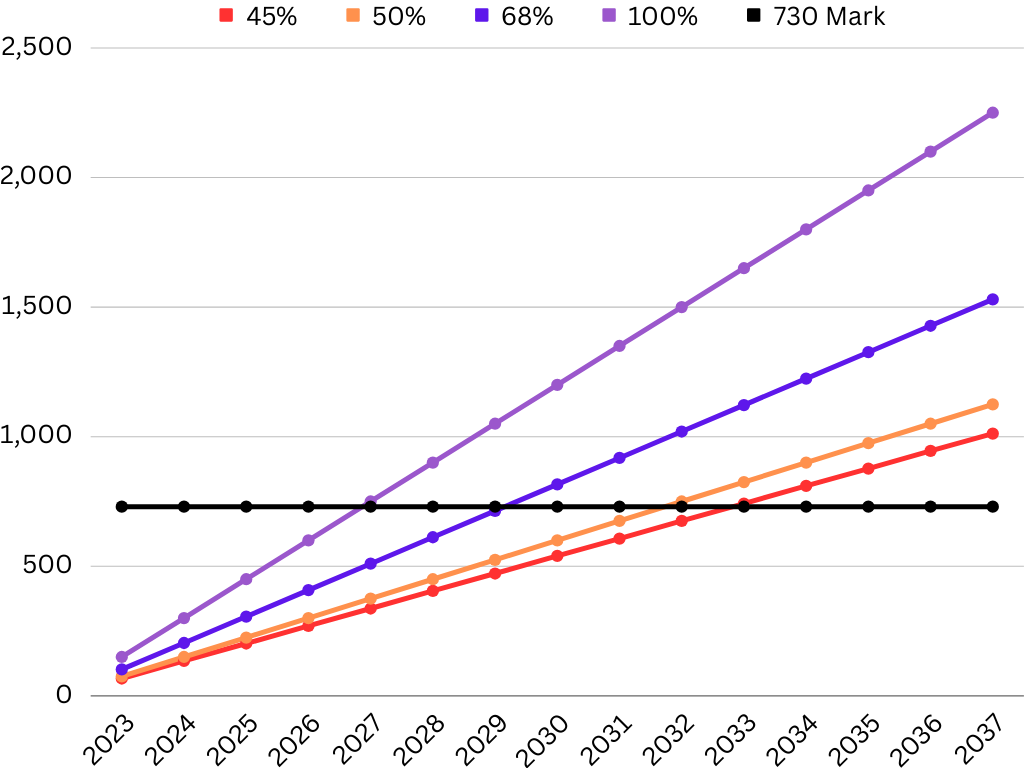
Figure 7 - Projection of the 10-15 period with varying levels of graduate retention
While the projection does indicate that a 68% retention rate would provide enough planners within the 10–15-year period, we cannot assume that all these UK jobs would be based in Scotland. If around three quarters of this 68% remained in Scotland, this would result in an overall graduate retention rate of 45-50%. While this retention would meet the threshold by 2033, it remains an assumption to conclude that such a significant portion of planners remaining in the UK will make the decision to work in Scotland and continue in the field of planning. We also note that this analysis does not have regard to planners who are drawn to Scotland from the rest of the UK or from overseas.
More research is required to obtain a clear picture of planning graduate retention specific to Scotland. However, the above analysis indicates that unless 45-50% of planning graduates are retained in Scotland, we will fall short of the replacement demand across the entire planning sector. This is based on the assumption that the 2022 figure of 150 graduates from Scottish planning schools continues into the future. This presents numerous concerns within the planning service as higher education is currently the main route for entrants into the planning sector seeking RTPI chartership.
The four main ways in which the shortage of graduate planners can be addressed are as follows:
- improving the visibility and marketing of planning as a career;
- enhancing the provision of planning education in Scotland,
- providing support for alternative routes into planning careers, and
- by effectively resourcing the planning sector in Scotland to enhance its viability and appeal as a career choice.
RTPI Scotland is currently working with other stakeholders to make progress on all of these fronts. In particular, the Institute is supporting new models of planning education combining work and study, with a pilot scheme under development.
Digital Planning
The Scottish Government’s digital planning strategy has continued to progress, being the featured topic at the 2023 RTPI Scotland Annual Conference. Several speakers discussed their visions for digital planning in Scotland, with representatives of the Scottish Government outlining their progress towards delivering the digital transformation strategy. [12]
The conference demonstrated numerous examples of the possibilities and developments for digital planning, including the joint project between RTPI Scotland and The Scottish Government. [13]
Progress on digital planning brings with it not just innovation, but economic benefits. The RTPI previously concluded that digital planning could benefit the Scottish economy by £200m. [14] In the face of resourcing issues that exist at present, this initiative is essential to ensure that stretched planning services can work at an optimum capacity and deliver all statutory duties efficiently and effectively.
References
[1] RTPI (2020) Plan the World We Need. June. Available here: http://bit.ly/2OvMyaf
[2] RTPI (2020) Invest and Prosper – A Business Case for Investing in Planning. October. Available here: https://bit.ly/2SBksMC
[3] Improvement Service (2023) Explore the data. Available here: https://bit.ly/47nHasN
[4] Scottish Government (2023) Summary Statistics – 2022-23 - Annual. Available here: https://bit.ly/3FQawnR
[5] RTPI Scotland (2022) Resourcing the Planning Service: Key Trends and Findings 2022. Available here: https://bit.ly/3QOX3ms
[6] HOPS (2021) Planning Fees – Time For Change. Available here: https://bit.ly/47oaWgV
[7] Montagu Evans, (2022) Planning Fees in Scotland Set to Rise From 1 April 2022. Available here: https://bit.ly/40sKFvQ
[8] eDevelopment (2022) Scottish Planning and Related Fees – As of 1st of April 2022 Available here: https://bit.ly/3Re7dfF
[9] Bank of England (Accessed September 2023) Inflation Calculator //set as of 2014\\. Available here: https://bit.ly/3sikiMy
[10] RTPI Scotland, HOPS, Improvement Service (2022) Future Planners Project Report, Research Project. Available here: https://bit.ly/487biJd
[11] Partners in Planning (2021) Skills in Planning Research Paper Available here: https://bit.ly/3FWPcwR
[12] Scottish Government (2023) Visualising the future Available here: https://bit.ly/3RzezM8
[13] RTPI (2021) RTPI to work with Scottish Government on digital transformation programme Available here: https://bit.ly/41hEr27
[14] RTPI (2020) Digital planning could benefit Scottish economy by £200m, says RTPI report Available here: https://bit.ly/3uW23x4


