
Measuring What Matters: Planning Outcomes Research
This research considers how local authorities can measure the outcomes of planning. This means going beyond simple metrics like speed of processing applications and number of housing units delivered and assessing planning in terms of placemaking aspirations and social, economic and environmental value, in order to track and improve the impact of planning.
Building on previous work that has taken place across the nations, the research team reviewed the context and needs of planning jurisdictions across the UK and Ireland, identifying guiding principles, developing a toolkit and then contextualising, testing and refining that toolkit.
The project has culminated in the development of a report and series of toolkits which can be adapted by local planning authorities across the UK and Ireland to improve their outcome measurement.
This research was commissioned by the Royal Town Planning Institute (RTPI) with funding support from the Governments of Ireland, Scotland and Wales, along with the Ministry of Housing, Communities and Local Government and the Office of the Planning Regulator in Ireland.
The research was delivered by a consortium of planning consultancies and academics from around the UK and Ireland, led by Kevin Murray Associates with support from Cardiff University, the University of Dundee, MacCabe Durney Barnes, and Yellow Book Ltd.
The research toolkit
The research has resulted in a series of documents, including a research report (see below), a Measuring What Matters, Planning Outcomes Toolkit (which can be adapted to any nation) and a handbook to accompany the toolkit.
The toolkit was tested through pilots in Ireland and Scotland and work was also carried out in Wales to produce a toolkit relevant to the Welsh context. You can view the Scottish Toolkit and information here, Irish Toolkit and information here and Wales Toolkit and information here.
Visit our RTPI YouTube page to hear the research team behind the RTPI Measuring What Matters: Planning Outcomes Research discuss planning outcomes and the research toolkit.
Read the report
Click here to download the Measuring What Matters: Planning Outcomes Research Report and separate appendices or read the research report including appendices below:

RTPI champions the power of planning in creating prosperous places and vibrant communities. We have over 25000 members in the private, public, academic and voluntary sectors. Using our expertise and research we bring evidence and thought leadership to shape planning policies and thinking, putting the profession at the heart of society's big debates. We set the standards of planning education and professional behaviour that give our members, wherever they work in the world, a unique ability to meet complex economic, social and environmental challenges.
About this paper
This research was commissioned by the Royal Town Planning Institute (RTPI) and jointly funded by the Governments of Ireland, Scotland and Wales, along with the Ministry of Housing, Communities and Local Government and the Office of the Planning Regulator in Ireland. The RTPI is very grateful to the project partners for their support in taking forward this work.
The research was delivered by a consortium of planning consultancies and academics from around the UK and Ireland, co-ordinated by Iain MacPherson MRTPI, with Kevin Murray FRTPI and Rim Chouaib MRTPI (Kevin Murray Associates), Dr Husam Al Waer MRTPI (University of Dundee), Dr Neil Harris MRTPI and Dr Brian Webb AssocRTPI (Cardiff University), Jerry Barnes MRTPI and Sybil Berne (MacCabe Durney Barnes) and John Lord (yellow book). The diversity of experience and perspectives this team brought to the project has helped inform not only the research process, but also in generating a set of practical toolkit outputs.
We would also like to thank the members of the Client Advisory Group, Chris Sinclair (Scottish Government), Sarah Shaw and Christine Cox (Heads of Planning Scotland), Niall Cussen, Sinéad Mullen and Gary Ryan (Office of the Planning Regulator, Ireland), Niamh Hanrahan and Colin Fulcher (Department of Housing, Local Government and Heritage, Ireland), Neil Hemington and Amy Ravitz-Williams (Welsh Government), Gareth Jones (Planning Officers Society Wales), Suzanne Walpole (Ministry for Housing Communities and Local Government, England) and Nick Porter (District Councils Network) for their time, guidance and advice.
In particular we would like to express our gratitude to the many individuals and organisations from across the UK and Ireland who took part in the Pilots (Loch Lomond and the Trossachs National Park, City of Edinburgh Council, North Lanarkshire Council and The Highland Council in Scotland, Eastern and Midland Region, Donegal County, Clare County Council and Dún Laoghaire Rathdown County Council in Ireland), Focus Groups, interviews and surveys, and gave up their time to provide valued views which have helped to inform this work.

Contents
Executive Summary
1.1. Why use this tool?
1.2. How is the tool to be used?
1.3. At which spatial scale is the tool applicable?
1.4. When to use the toolkit?
1.5. What are the benefits of using the tool?
1.6. Conclusion
1. Introduction
2. Why does measuring planning outcomes matter?
2.1. Literature review and evidence base
2.2. Linking to United Nation Sustainable Development Goals and National Outcomes
2.3. Challenge and Value
2.4. Moving from outputs to outcomes to impact
2.5. Users and Audiences
3. Research process and findings
3.1. Egan Wheel – Sustainable Communities
3.2. Sustainable Built Environment SuBETool Framework
3.3. RIBA Sustainable Outcomes Tool
3.4. ‘Le référentiel ‘Un aménagement durable pour la ville de Paris’ - Tool for evaluating the sustainability of urban places
3.5. Focus group key messages
3.6. Pilots and contextualisation
3.7. Scotland context and pilots
3.8. Key lessons from Scotland pilots
3.9. Ireland context and pilots
3.10. Key lessons from Ireland pilots
3.11. Wales contextualisation
3.12. Key messages from Scotland and Ireland pilot
4. The toolkit concept
4.1. Developing a toolkit
4.2. Outcomes – defined at plan level
4.3. Toolkit theme categories and indicators
4.4. Data sources
4.5. Scoring
4.6. Review
4.7. Visualisation of the toolkit results
5. The toolkit in practice
5.1. When to use the toolkit?
5.2. What are the benefits of using the tool?
6. Recommendations
References / Bibliography
Acronyms
Appendix A: Survey summary
Appendix B: Illustrative data mapping – Scotland and Ireland
Appendix C: Developing the toolkit – a worked example
Executive Summary
The philosophy and practice of planning have become more complex in the last twenty years. The scope of challenges nationally and locally has led to shifts in legislation, policy and in expectations of planning. The Royal Town Planning Institute and its partners across different jurisdictions now seek better mechanisms to track future performance against this changing background, looking beyond measurement of processing speed and simple outputs.
Building on previous research that articulates these higher aspirations, the RTPI has commissioned this piece of research to help provide practical ways to gauge how planning delivers on the explicit aspirations of planners and elected representatives, in terms of placemaking and social, economic and environmental value.
This research report is accompanied by a suite of documents to deliver on the research aims. The report covers the research background, process and findings before presenting a practical toolkit that can be used to begin the process of measuring the impact of planning. There is a Handbook that offers practical guidance, documents on the pilots carried out in Ireland and Scotland (including worked examples of a first cycle of toolkit use), the Welsh contextualisation and finally excel sheets providing the practical framework for implementing this new process of measurement.
Bearing in mind that recent planning legislation and policy in Ireland, Scotland and Wales, as well as the UN Sustainable Development Goals (UN SDGs), confirm this directional shift, the toolkit has a complex set of performance parameters to address. This involves shifting measurement beyond narrow development outputs to consideration of wider place outcomes and impacts. In addition, the toolkit needs to be flexible and adaptable, able to be used in different jurisdictions, and to respond and aid performance improvement over multiple monitoring cycles.
A research team led by Kevin Murray Associates[1] has reviewed the context and needs of each of the planning jurisdictions across the UK and Ireland. The stages of the research comprised:
Phase 1 – Finding the guiding principles
Phase 2 – Developing the base toolkit
Phase 3 – Contextualising and testing
Phase 4 – Refining and reporting
Through the consultative stages of the research it became clear that a sudden ‘switch’ to measuring the outcomes and impacts of planning poses operational, resource and data challenges. However, a staged transition towards a more ambitious approach is possible and we have accordingly developed a pathway with a measurement tool at its core.
This toolkit will assist planning authorities and other users to gauge how planning policy and decision-making impacts on placemaking, including social, economic and environmental value. By using the toolkit and appropriate sectoral indicators, authorities and partner agencies should have the means to track performance, not only of those aspects directly attributable to planning, but also those areas where planning activity contributes indirectly to wider outcomes.
This document should therefore be read not only by planning professionals and fellow practitioners, but by politicians, civic and community representatives, and partner agencies in environment, economy, health and wellbeing who seek a more integrated set of place outcomes.
1.1. Why use this tool?
The primary function is to aid understanding of the impact of planning policy and development management in a geographic area. Where the data is available this can be aggregated up to regional and national levels. As the performance review material is built up over time the impacts on place creation can be captured, with the intention of progressively helping improve places and outcomes. The toolkit demonstrates the value of planning’s contribution to environmental, economic and societal outcomes, making it a useful evidence base across all levels of government.
The toolkit can also be used in collaboration with other agencies and sectors, to align strategic goals, indicators and investment priorities. The pathway can help planners and other partner agencies to focus on integrated outcomes within defined territory.
1.2. How is the tool to be used?
The tool enables the integration of multiple areas of change and influence of the planning system within a single format. The research has identified eight outcome themes:
- Place – design and people
- Health and wellbeing
- Environment – conservation and improvement
- Climate change
- Homes and community
- Movement
- Economy and town centres
- Process and engagement
These support the alignment between planning and national and international outcomes.
The idea is to initially use data that is already available within planning, local authority or other agency tracking – rather than generate new measures. The tool can be applied as part of an annual monitoring process or as part of a plan-making and implementation cycle. The tool is ready to use for any plan regardless of its stage, ideally where there are clear targets or objectives that can be tracked by indicators, but it can also help set these.
The pathway indicates how it is possible, if data is tracked over cycles, to move up levels to increase the focus on higher levels of place outcome.
1.3. At which spatial scale is the tool applicable?
The tool is flexible enough to be applied to any spatial scale where there are a set of objectives and/or policies. This includes use within different national jurisdictions. Typical levels would be at local authority level, or at development plan level.
The tool can potentially be used at the spatial scales of a town or city, rural area or even a coherent neighbourhood or masterplan area. We have already piloted the toolkit based on Local Development Plans, Regional Plans and Energy Plans. The application of the toolkit depends upon having a set of objectives, and appropriate measurable indicators against which to track performance, or to use it to assist in setting these.
1.4. When to use the toolkit?
The toolkit can be used as a reflective analytical tool at the start of a plan preparation process. The review of a pre-existing plan can demonstrate the impact that the plan has had over the course of its life. The performance review can also provide an evidence base for what needs to be adjusted in any new/update plan or in development management decisions.

Figure 1: Toolkit entails a cycle of evaluation that can both measure and aid improvement
The tool is to be used in an overall performance monitoring cycle, with diagnosis, review and implementation built into its process. For a development plan this would include a baseline stage, mid-plan review and review ahead of the next iteration of the plan.
Other timeframe applications are possible and could be subject/theme specific. To review the relationship between adopted policy and development management decisions, for example in relation to climate change, decarbonisation or health and well-being.
Another use may be to refine a plan mid-cycle. The climate emergency and Covid-19 crisis flag up that action needs to be taken immediately and planning can play a critical role in this without waiting for the formal process of creating a new plan. The tool can help review existing performance and identify areas where additional guidance or mid-plan policy adjustments need to be made.
The tool would also make a useful basis for comprehensively assessing determinations made through the various appeal systems. This could provide a valuable transparent evaluation of such decisions and the degree to which they comply with local and national policy.
It is envisaged that, at least initially, the primary users of the toolkit will be planning authorities, along with performance monitoring colleagues in both national and local government. Initial use of the toolkit builds upon existing data and material. To be effective in building up data coverage and analysing performance across wider sectors will require input from economic development, environmental and health agencies, so they will also be contributors, users and potential beneficiaries in tracking the planning contribution to their strategies and goals, using the toolkit in an integrated approach to place.
Once the toolkit and data are available, we can see a wider range of beneficial users including
- Citizens, civic groups, residents and business stakeholders within the area who need to measure place-based outcomes (for example for funding reporting).
- Developers, investors and consultants behind key masterplan and development projects, looking to ensure that their proposals are outcomes-based and compliant with wider aims.
- Researchers such as universities, professional bodies and even the local and national media (consider interest in Covid-19 statistics).
- New cross sectoral planning partnerships – e.g. public-private or non-governmental organisations – as basis for tracking new plans and strategies.
Once established with publicly available data it should be possible for interested members of the public to use toolkit to aid the assessment of the impact of planning in their area. In much the same way that the Place Standard[2] tool has secured wider community application, the tool could be of interest to community groups and organisations concerned with the role and impact of planning.
To optimise the range of beneficiaries once established, it will be important that all material is publicly available across all sectors of indicator.
1.5. What are the benefits of using the tool?
 The utility of the toolkit and the ‘results’ arising from its use will include:
- Tracking performance/progress over time.
- Integration across policy sectors and themes.
- Understanding what has worked, what has not worked; identifying possible causes and what needs improving or abandoned in future.
- Informing Development Management and decision-making.
- Raising aspiration towards delivering better planning outcomes against strategies/plans/ policy goals.
- Visibility/transparency of outcomes and impacts at local levels.
- Aggregation and benchmarking of performance at regional and national scales.
- Raising shared factual/scientific awareness between different parties and stakeholders.
- Educational dimension in terms of knowledge transfer, skills and awareness/use of data.
1.6. Conclusion
Although the tool has been researched and generated for peer to peer use within planning, it is clear that, once established, the toolkit has many potential applications, audiences and beneficiaries.
By providing the basis to move towards, and progressively evaluate, a whole systems approach to planning and placemaking, it makes the connection between policy, decision making and the quality of outcomes in social, economic, health and environmental terms.
Because it can be used to track performance using open shared data, it can be used both as an objective evaluation tool and, potentially, as an integrative/advocacy tool within Government and the corporate approaches of the public sector agencies.
It can also support the private and third sectors in developing higher performing placemaking in their investments, for instance in reducing carbon or improving health and wellbeing.
The toolkit affords the potential basis for monitoring, evaluating and then improving planning in the public interest, building confidence in the system based upon actual performance.
This all depends on the next stage of refinement and development, and ultimate adoption within different jurisdictions to suit their circumstances.
1. Introduction
This Measuring What Matters: Planning Outcomes research was commissioned by the Royal Town Planning Institute (RTPI) and the national Governments in Scotland, Ireland, Wales and along with the Ministry for Housing, Communities and Local Government and the Office of the Planning Regulator in Ireland. [3] The research team, led by Kevin Murray Associates, comprised yellow book, McCabe Durney Barnes, University of Dundee and Cardiff University, providing a mix of practitioners and practice-oriented academics who have extensive experience of working in planning throughout the UK and Ireland. The diversity of experience and perspectives this team brought to the project has helped inform not only the research process, but also generating a set of practical toolkit outputs.
Measuring planning outcomes is not necessarily new territory. There is a relative wealth of previous research in this area from which to draw. So why is this such a key piece of work for planners and planning at this moment in time?

Planning has undergone considerable change over the last decade or so. The 2008 Global Financial Crisis has left a long-lasting legacy on communities and their physical place, with many having a long and slow claw back. The climate emergency and health crises are putting pressure on society and on place. 2020 has seen floods cause huge levels of damage, followed quickly by the response to the Covid-19 crisis and lockdown. Both of these illustrate the need for places to be more resilient, and this is before accounting for chronic and systemic issues such as health inequalities and the need to meet carbon targets.
In addition, there are other pressures from reduced capital investment in communities and constrained local service delivery. While these may not all be strictly planning issues, they are factors connected to place quality and liveability.
For planning, in practical terms, this has meant a system that is increasingly being pressurised to focus on delivering a service to immediate plan-users, seeking out efficiencies and generating revenue, rather than an outcome focus. With a growing dislocation between plan-making and development management there has emerged a drive to measure performance: in consents granted and units delivered. If ‘you are what you measure’, then this has increasingly left us with a system in which success is viewed narrowly through the prism of process performance outputs, rather than wider quality of life and physical place outcomes. At a time when we need a response to economic, environmental and societal pressures, planning needs to demonstrate that it can deliver in the wider and longer-term public interest.
The research approach comprised the following elements:
First, we sought to identify what planning systems are trying to deliver across Ireland and the constituent planning jurisdictions of the UK. How do we measure performance of this delivery now? If we are seeking better place outcomes, what should we be measuring?
Second, we considered what data sets and digital solutions are available to help enable the measurement of outcomes. We aimed to develop something that is useful, practical and is not a large additional burden to any authority or other user; otherwise it will not be used.
Third, we have developed and piloted a toolkit for measuring planning outcomes. Drawing ideas and suggestions from performance management and sustainability research, as well as planning research, we have evolved and tested the toolkit with different participants. To avoid creating something that becomes either onerous or unthinking box-ticking, the emphasis has been on practicality and utility.
To help contextualise this toolkit for the respective planning jurisdictions, we have run pilot exercises in Ireland and Scotland, and developed a contextualised tool for Wales. These have helped to explore and test the utility of the tool, exposing where it may be less practical and enabling changes to be made to improve efficacy.
Although the explanation may make the process sound simple, there has been a lot of complexity and diverse practice to unravel. If it were really so simple planners would probably already be measuring outcomes. Part of this complexity is picked up by Al Waer:
“planning for outcome oriented place [is] a moving target where there is neither a ‘state to be reached’ nor a ‘one-size-fits-all’ solution”.[4] For example, “healthy/well-being outcomes do not happen as an outcome in a ‘predetermined way’. It requires to be carefully discussed, openly debated and even centrally planned.” [5]
Our research has discovered there is a groundswell of enthusiasm within planning for this outcome-focused approach. It touches at the very heart of why so many planners have entered the profession in the first place. They want to have a meaningful impact on place and its communities; if they are what they measure, they want to know what that impact is.
This report sets out the baseline evidence and learning from the research, the toolkit concept and the toolkit itself. This aims to be a practical document and is accompanied by a separate “handbook” that can be used for quick reference around the jurisdiction contexts and in practice used alongside the toolkit documents which can be downloaded in excel format from the RTPI project page.
We also consider this to be the continuation of an ongoing evolution, although accelerating that process. As such we make a series of recommendations around next steps and implementation. This will not be a quick process. Work can and should begin now, but it needs to be ongoing. The benefits to planning, to place and to wider society will be far reaching if we can measure impact, learn from this and create places with the right outcomes.
2. Why does measuring planning outcomes matter?
2.1. Literature review and evidence base
Our review has drawn from academic publications on planning and sustainability, previous research on planning monitoring and outcomes, and other review literature on policy. We have also looked to other disciplines such as community learning for lessons on how their area of practice defines the monitoring and evaluation of its activity, inputs, outputs, outcomes and impacts.
The line of thinking emerging from the literature review is as follows:
- First, statutory planning has some established methods of monitoring across different jurisdictions, but these neither lead towards, nor equate to, a broad understanding of what planning actually achieves in terms of delivering better places. There is a consensual recognition that planning has a broader and longer-term impact, but that this is not systematically captured and demonstrated.
- Second, monitoring and evaluation are part of a longitudinal process, not a single moment in time. Such monitoring and evaluation takes place at different scales. These time and scale factors are complex, reflecting the reality of dynamic places where change is rarely driven by a single factor. In this sense, monitoring and evaluation of planning is not really about simplistic cause and effect, as may occur with other systems, but about understanding and measuring place-impact. Measuring what change occurs at different scales (and the subsequent impact on people’s lives, nature and the built environment) becomes the objective, rather than counting units, speed of decisions or whether a single policy has been delivered.
 Third, there needs to be a higher-level anchor for this process. This could be supplied by maintaining alignment with the accepted outcomes in the UN Sustainable Development Goals[6] (UN SDGs) that have been adopted and adapted by national governments.
Effective proactive planning can contribute to the creation of successful places, which in turn can produce considerable economic, social and environmental benefits for society over the medium-term[7]. The recently published work commissioned by the RTPI Invest and Prosper demonstrates these benefits, and can put a monetary value on this[8]. Local planning authorities use planning policy and the process to articulate and deliver their spatial objectives respectively. By producing monitoring reports, they can demonstrate to the local authority, its partners and residents the progress towards their adopted plan, identifying the extent to which policy goals are being met and altering those which need to be amended. Planning authorities use a mix of qualitative and quantitative indicators to document planning activities and some make use of case studies to explain successful outcomes.
Planning Authorities in Scotland produce an annual Planning Performance Framework (PPF) to report on their own planning service. The PPF has been in operation for eight years, aiming to create a consistent method of measuring performance. Annual reporting has now been placed on a statutory basis by the Planning (Scotland) Act 2019. In England, Planning Authorities use Annual Monitoring Reports (AMR) to ‘advertise the achievements of good planning’[9]. Themes in the AMR are typically around the quality of development, planning performance, user and neighbourhood experience, and infrastructure delivery. In Wales, Local Planning Authorities produce an Annual Performance Report (APR) that uses a range of performance monitoring indicators to demonstrate how well authorities are performing, both individually and in relation to a Wales-wide context. In Northern Ireland the Planning Monitoring Framework (PMF) was introduced in 2019 to address the gap in the three statutory planning indicators. This introduced additional indicators to provide a more comprehensive assessment of planning activity and cover a wider perspective of the work of Planning Authorities. It presents a summary of the indicators for Northern Ireland, and other relevant indicator data for each local planning authority[10].
In Ireland, the Office of the Planning Regulator (OPR) is developing a Planning Performance Assessment Framework (PPAF) within which agreed process and outcome targets will be developed for performance and effectiveness measurement[11]. The PPAF will represent the OPR’s reporting mechanism for the oversight of the delivery of effective planning services to the public by Planning Authorities, and the performance by the An Bord Pleanála and Planning Authorities of their respective functions, as required under the Planning and Development Act. However, the PPAF will also consider the wider context of what constitutes proper planning and sustainable development and the planning and development system’s interaction with other social, economic and environmental processes and challenges.
Although these various monitoring reports provide a general picture of the ‘process performance’ of planning authorities, they rarely address that in terms of outcomes of planning, particularly when scaled up cumulatively over time in a neighbourhood, town or region. More and more, particularly since the evolution of integrative, spatial planning as expressed in the RTPI’s own New Vision for Planning[12], there has been a shift towards a place-based approach. Within this approach planning is expected
‘to deliver ‘better places’ or to contribute to wider policy goals such as health and wellbeing, learning, productivity, community cohesion and climate change resilience’[13].
Studies have been commissioned to address this ‘wicked problem’. In the Outcome Indicators for Spatial Planning in England – Framework Report15, Wong et al, looked at the objectives and desired outcomes of the spatial planning system in England. She described the outcomes of spatial planning as
‘derived from the objectives of planning. They are broadly drawn and will reflect more than just policy objectives, identifiable inputs or directly measurable outputs. Outcomes should be viewed as the combined effects on socio-economic and environmental changes brought about by the planning system and other forces that seek to achieve sustainable development and sustainable communities’.[14]
The study also highlighted the need to examine spatial outcomes at different scales, as there is a difference between the desired outcomes on a national scale and those at regional or local scale. Shahab et al, in Impact-based Planning Evaluation: Advancing Normative Criteria for Policy Analysis[15], advocates for an impact-based approach to planning evaluation that takes into account the intended and un-intended effect of public policy, as an alternative to the conformance-based evaluation approach. In that model, the success of a public policy instrument is built on the degree of conformity between the policy outcomes and its intended objectives without taking into consideration any unintended or secondary effects.
Traditionally, outcome monitoring has been predicated on a direct, linear ‘cause and effect14’ relationship between interventions and outcomes. The Scottish approach, for instance, is characterised by ‘a move within public services from top-down, service-led, reactive delivery, towards more personalised, preventative and collaborative ways of working’. It acknowledges that interventions interrelate with multiple other factors to influence outcomes[16]. Delivering Change18 is a policy document on understanding outcomes in community learning and development. This defines outcome as the changes that happen as a result of action, it recognises different types of outcomes, those that may occur rather quickly and as a direct result of the actions and long-term or end outcomes and are more difficult to measure[17].
In Ireland, the Planning Policy Statement[18] recognises the importance of ensuring quality of outcomes through the planning system.
“The success of our planning process will be judged by the quality of the places that result variously from, the development of new places, the regeneration of existing places and the protection or enhancement of places that are particularly sensitive because of the natural and/or cultural heritage or environment they contain.”
It also emphasised the need to deliver quality public services. The language of the Project Ireland 2040: National Planning Framework (NPF)[19] stresses the policy objectives of ensuring quality outcomes, valuing our environment and creating places where people will want to live, work and recreate.
When devising a tool to monitor the outcomes of planning, AlWaer et al[20] stressed that indicators should be chosen to link clearly between the objectives and outcomes, should be pre-defined and limited in number. They referenced Core Categories and Subcategories and recognised geographic variation, suggesting rural areas might need to have their own, different categories and indicators. They also emphasised the importance of timescale considerations because different indicators are measured across different timescales.
A useful monitoring and evaluation model developed in Paris as a sustainable urban development planning tool provides a system of indicators that take into consideration both the direct and indirect impact and the national/regional/local scales.[21]
These ‘Paris indicators’ take the form of an ‘active dashboard’ providing an on-going monitoring and evaluation operation over time. The dashboard is structured around four main axes and 21 objectives and brings together qualitative and quantitative indicators. These become the tool by which to gauge the outcomes over time. The indicators are measured at the different stages of a development project (design, works, management) on a scale of performance ranging from 1 to 5. Thus, the dashboard tracks two complementary objectives, evaluation and monitoring:
- Evaluate the performance levels in sustainable development of operations, with regard to the objectives targeted by municipal policy. This usage makes it possible to compare the performance levels achieved by operations, without losing sight of their own context;
- Ensure follow-up against the targeted objectives specific to each operation.
The Monitoring the Outcomes of Planning[22] study by yellow book demonstrated the support for moving towards a regime of outcome monitoring and impact evaluation and emphasis on the fact that monitoring should be a universal system and should capture outputs and outcomes from all planning applications.
The Place Standard2 tool, initially evolved by NHS Scotland, Architecture and Design Scotland and the Scottish Government, acknowledges, explores and records the performance of various facets that contribute to place quality and experience of it. It recognises that place outcomes are a composite of interacting factors and policies at different scales:
‘Place-based approaches help make the link between actions and wider outcomes and encourage us to Think Global and Act Local[23].’
This fairly simple multi-dimensional tool helps users to understand the connection between place, planning and outcomes.

Figure 5: Framework for sustainable communities and cities, UN SDGs
2.2. Linking to United Nation Sustainable Development Goals and National Outcomes
Although there is a current approach to monitor planning performance as a process in most jurisdictions, there is less evidence of tracking this against broader national and international objectives, although this is changing.
Understanding and evaluating the impact of planning in relation to higher level goals, such as the UN SDGs, or other national government outcomes tied to these, is ambitious and still in the early stages. Our survey evidence (Appendix A) suggests that while this is progressively being established in many places, there is still not necessarily a clear knowledge of what is being delivered through the planning system. If there can be more comprehensive data on the outcomes of a planning application for example, looking beyond simply number of units built, then evaluating the wider cumulative impact would represent a considerable leap in understanding performance.

Figure 6: Ireland's National Strategic Outcomes - embedded in the National Plan and reflecting Ireland’s commitment to the UN SDGs
Ireland has established 10 National Strategic Outcomes under the Project Ireland 2040[24]: NPF which are linked to the UN SDGs and range from compact growth to ensuring access to quality childcare, education and health services. The Regional Assemblies and the Regional Spatial and Economic Strategies (RSES) play a unique role in translating between the national and local level policy frameworks. The Project Ireland 2040: NPF also identifies that the Office of the Planning Regulator (OPR)
“…will be responsible for monitoring and implementing the NPF[25] .”
To aid it in its future work, the OPR is developing a Planning Performance Assessment Framework (PPAF) within which process and outcome indicators are being considered for the measurement of performance across the planning system.

Figure 7: Scotland's National Performance Framework Outcomes, aligned with the UN SDGs
The Scottish Government has established eleven National Outcomes that “describe the kind of Scotland it aims to create[26]” and uses 81 National Indicators to measure the progress towards them. Performance is assessed as improving, maintaining or worsening based on the change between the last two data points of an indicator. All these outcomes align with the UN SDGs and the Scottish Government’s own Place Principle[27]. This is reflected in the high level outcomes stated in the upcoming National Planning Framework 4 (NPF4)[28].

Figure 8: The Well-being Goals for Wales29 - embedded in commitment to UN SDGs
Wales has seven well-being goals that were established by the Welsh Government in the Well-being of Futures Generations (Wales) Act 2015. With the aim being to improve the social, economic, environmental and cultural well-being of Wales. In total some 46 national indicators have been selected by the Welsh Ministers as a reference framework, to measure performance against the goals. Each year a Well-being of Wales report[29] is released that provides an update of the progress, with a more detailed report produced every four to five years to review long-term performance.
In terms of planning more specifically, there is a combined All Wales Planning Annual Performance Report based on the Annual Performance Reports (APRs) submitted to the Welsh Government by Local Planning Authorities. This considers the operational performance of the planning system, including key trends in performance. The Wales Audit Office has published The Effectiveness of Local Planning Authorities in Wales that looks at
‘the progress of Local Planning Authorities in delivering their new responsibilities and the extent to which they are acting in accordance with the sustainable development principle contained within the Wellbeing of Future Generations (Wales) Act 2015. It also considers how efficient and effective the ‘local planning system’ is, focussing on their performance, income and expenditure to determine how resilient services are.’ [30]
Northern Ireland use the monitoring arrangements for the Programme for Government to show how progress is being made towards the UN SDGs. In other governmental departments, mapping exercises have been carried out to show how delivery plans align with these goals.[31] The UK Government notes that the best way to implement the UN SDGs is to embed these in the planned activity of government departments. A 2019 corporate report sets out some of the ways in which the UN SDGs are being implemented by the UK Government.[32]
2.3. Challenge and Value
The core purpose of the planning systems as they have evolved to date is built around the regulation of the use and development of land in the public interest. Recent iterations of legislation and national policy have broadened this core to embrace sustainable development, placemaking and wellbeing.
Effective planning helps to ensure economy, efficiency and amenity in the use of land, reconcile the needs of development and conservation, and protect natural resources and the historic environment. By fulfilling this core purpose and meeting agreed local performance targets, planning makes a direct and indirect contribution towards national and regional policy goals, and also, when tracked, to the UN SDGs.
Sitting above its basic regulation of land use, planning also has a higher order role to create attractive, well-designed, sustainable places which will improve the quality of life of the people who live, work, learn and spend leisure time in them. Planners can help to achieve better place quality by, for example, publishing and applying design guidance and conducting design reviews. An extensive research literature attests that better design quality can also help to deliver place value in the form of positive health, social, economic and environmental impacts.[33]
Measuring the impact of planning on goals such as improving health or learning outcomes, promoting economic competitiveness or increasing biodiversity is inherently complex, but it is essential in order to determine whether (and how) the potential wider benefits of planning are being realised. Within such a broader measurement lies the key challenge around the question of attribution[34]: how can we demonstrate that what planning does has a contributory impact upon wider policy domains? A lot of progress has been made in this field in recent years, drawing on the growing body of research literature on how the built environment influences behaviour and wellbeing. By mining this body of research, policy makers and academics have been able to develop principles and standards that capture and codify place quality. Examples of this approach can be found in local design guides, the Scottish Government’s Place Standard2 and the recent Place Alliance31 report on Place Value & the Ladder of Place Quality, Creating Places for People in Ireland[35] and Places for Life from the Design Council for Wales[36]. Using these and similar tools we can frame SMART goals, performance indicators and targets which can act as reliable proxies for gauging place quality.
The toolkit presented in this report maps out the key levels in the evolution of an outcomes/impact monitoring framework for planning:
- The first level (Level 1) calls for the monitoring of planning activities, including plan-making, and the immediate, short-term outputs of those activities – for example, planning permissions granted (see Template Toolkit Level 1 tab for examples).
- The second level (Level 2) focuses on monitoring medium term planning outputs and development outcomes, notably the conversion of planning consents into development started and completed: at this point we can monitor progress towards the targets set out in development plans (See Template Toolkit Level 2 tab for examples).
- The third level (Level 3) takes us into the wider policy domain by focusing on the evaluation of place value and impacts resulting from the operation of the planning system: have new developments conformed to best practice in architecture and urban design, and what inferences can we draw in terms of their contribution to policy goals (see Template Toolkit Level 3 tab for examples).
2.4. Moving from outputs to outcomes to impact
There is significant variation in both the in-house performance management standards of different planning authorities and the reporting requirements of different jurisdictions. Consultations for this study suggest that most planning authorities are at Level 1 or Level 2. Level 2 might be considered to be the minimum requirement for effective performance management and democratic accountability. The study has also revealed an appetite among planning professionals to advance to Level 3. There is a desire to understand, quantify and publicise the benefits of planning for place value, balanced by an awareness of the methodological challenges and resource implications of commissioning evaluation studies. We have argued that Level 3 impact evaluation is only possible if robust Level 1-2 monitoring data are available.
Level 1-2 monitoring enables the development of a core set of metrics which can be used by policymakers, service managers, built environment professionals, researchers, the media and communities to:
- Make the planning system more transparent and accountable,
- Measure the efficiency, effectiveness and value of the planning system, and
- Benchmark the performance of planning authorities – being able to note improvement over time.
Level 3 performance management enables the same audiences to make informed judgements about:
- How the planning system can promote place value and place quality.
- The impacts of planning over time on place quality and wider societal goals.
- What works and what does not.
- Whether and to what extent the planning system is delivering better places.
2.5. Users and Audiences
To understand whether (and to what extent) planning is achieving its purpose we ideally need an outcomes monitoring framework which will:
- Establish performance indicators and tracking measures for the planning system.
- Set targets for planning activities, outputs and outcomes.
- Monitor the development plan and development management processes.
- Monitor the outcomes of the planning process in real places.
- Evaluate the direct impact of planning on place quality.
- Evaluate the indirect impacts of planning on health, social, economic and environmental place value.
Having a clear understanding of how the planning system is performing is important for:
- Politicians and policy makers (national, regional and local) who need to know whether the goals of national and regional planning policy are being achieved.
- Planning service managers, to help them understand whether their planning system and resourcing is operating efficiently and effectively, and to benchmark the progress of planning authorities.
- Planning authority practitioners, to help them to learn lessons from experience and modify practice to improve outcomes.
- Partner sectors and agency policymakers and analysts, to keep them informed of planning contribution and promote effective dialogue and alignment with the planning system.
- Wider community and civic groups, so that they can scrutinise the work of the planning system and call it to account.
- Applicants who wish to see how the planning fees they are paying into the system represent value for money.
3. Research process and findings
The project process can be characterised by the following four phases:
Phase 1 – Finding the guiding principles
A literature, policy and systems review and series of early consultations - the output was a working paper that included definitions around terminology to provide clarity for the next phase of engagement. The paper set out a draft set of guiding principles for the development of the toolkit. This informed the questionnaire and early development of the toolkit.
Phase 2 – Developing the base toolkit
This second phase involved engaging with a wider network of planning system operators (primarily local authority planners) to understand their needs and current measurement/monitoring regimes. This provided us guidance on what types of indicators the draft toolkit could and should potentially contain. The phase 2 output was captured in the Interim Report and comprised findings from our wider network engagement, the development process of the toolkit and presented a draft toolkit.
Phase 3 – Contextualising and testing
This stage provided an important opportunity to test the toolkit and to make amendments as necessary. We undertook contextualisation of the toolkit for Ireland, Scotland and Wales, receiving feedback on elements that worked well and less well. Phase 3 outputs were reported in a second working paper on the feedback, analysis and contextualisation of the toolkit testing.
Phase 4 – Refining and reporting
This final phase included holding online pilot sessions in Ireland and Scotland (we could not undertake in person sessions due to the Covid-19 pandemic). These explored contextualised toolkits for each of these jurisdictions and entailed a review with participating local authorities’ staff from different geographical locations in each country. These sessions became the basis for the drafting of this report and further refinement of the toolkit itself.
An integrated process of planning and development directed toward the vision of promoting place-based outcomes requires that targets are clear, progress is monitored, and performance is made transparent. The process of ongoing feedforward and feedback of such intelligence promotes adaptive planning that recognises complexity and relies on experimentation, learning, and capacity building. Accordingly, measuring planning outcomes need to be developed within an inclusive assessment framework, drawing together current performance frameworks with this approach in a collaborative manner with governments, planning authorities and users of the planning system. The assessment framework, adapted from Pearce[37] and Pearce and Barbier[38], needs to be informed by measurements and assessments that embody the following:
- The need for indicator sets that align development with a comprehensive setting of Sustainable Development Goals;
- Principles, goals, and standards;
- The importance of broadening the scope of how development is measured (i.e. this should have both qualitative and more readily measurable quantitative impacts; and
- The importance of extending assessment time horizons (including future generations among stakeholders), recognising the long-term consequences of actions, and anticipating long run pathways for managing the critical path to the desired future.
Figure 9 sets out the elements of a conceptual framework developed by AlWaer et al for measuring planning outcomes[39]. The figure below illustrates a general process covering the phases of issue shaping, setting goals and objectives, generating and comparing project options, selecting preferred solutions, implementing and subsequently monitoring those solutions, and evaluating performance. It identifies the mix of actors and the dimensions and time scales related to measuring sustainable place-based outcomes. Different sets of actors may be engaged at different stages of the process.

Figure 9: Sustainable Community Assessment Matrix, Al Waer et al 2014
We have reviewed a range of toolkits that are comparable to the product that would be required as a mechanism for tracking and measuring outcomes. The research team was already familiar with a number of these toolkits from previous experience with measurement and evaluation and have researched some new comparators through this project.
From the toolkits that we have reviewed, often generated for slightly different lead purposes, such as sustainable communities or masterplan performance, there is a broadly common structure. This structure creates a useful framework for understanding how a toolkit might function, on to which we can translate the needs of the Measuring What Matters project. Some of the key exemplars that have informed the generation of the toolkit are listed below.
3.1. Egan Wheel – Sustainable Communities

As part of the Egan Review[40] into the skills required for establishing sustainable communities, led by Sir John Egan[41] this tool was developed to understand whether a place or community can be considered to be sustainable. The tool now turns out to relate to Sustainable Development Goals 11.
This tool identified seven thematic/policy areas of goal/target with a mix of objectives and 50 subjective/perceptual indicators within each. The tool acknowledges that some indicators will work better at different spatial scales than others. For example, economic performance indicators may work best at a city, region or sub-region scale, while indicators that use resident perception work better on a more localised scale.
This tool provides useful insight into building an evaluation framework, linking primarily existing indicators and data to a high level performance goal. The ability for this tool to work across different spatial scales is a key learning point, as is the aggregation of subjective data alongside more objective statistics.
3.2. Sustainable Built Environment SuBETool Framework

SuBETool is a strategic planning and performance assessment methodology for spatial plans and masterplans, developed with University of Dundee, Hilson Moran and Reading University, and evolved from Dr AlWaer’s doctoral and post-doctoral focus on assessing sustainable development performance.[42]
The initial research objective was to critically examine linear-sequential models of assessment methods, including BREEAM Communities (UK), LEED ND (USA), and Green Star (Australia)
The development of the SuBETool highlights the multi-factorial nature of masterplanning and the requirement for a working consensus about critical issues, local values and their relative importance.
3.3. RIBA Sustainable Outcomes Tool

This tool has been developed to aid targeting, designing and evaluation of sustainable outcomes for buildings. The tool connects to the UN SDGs, identifying where sustainable buildings would make the most direct contribution towards these goals.[43]
The RIBA (Royal Institute for British Architects) tool makes this connection to higher level goals through four themes and eight outcomes. Using a blend of quantitative data around energy and resource use, plus factors around health and wellbeing, the tool uses a scale for each outcome that is relevant to the indicator, but still provides an overall picture of achieving the outcomes in a single, simple graphic.
3.4. ‘Le référentiel ‘Un aménagement durable pour la ville de Paris’ - Tool for evaluating the sustainability of urban places

This is a tool to enable follow up and evaluation of spatial planning operations (from forward planning to development management). Its role is to support the application of the Paris Plan Local d’Urbanisme (Local Development Plan) for the City of Paris (not the higher-level region, or the lower level districts)[44].
The tool was designed to ensure that the objectives of sustainable development were considered within spatial planning. It is principally used by the technical staff of the local authority, specifically the heads of the various departments. It also is applied to those providing a service to the City Authority, namely development agencies or approved housing bodies. It is applied at all levels of the planning hierarchy in the City, including project levels through all phases. It is based on four axes, with each axis accompanied by objectives and indicators.
An external evaluator is appointed to undertake the lower level evaluation of projects resulting from policies. These projects are generally best described as local authority or public private partnership led projects. To test this, they selected a sample of 20 projects to monitor over two years. The results of the evaluation then serve to revise policies and update objectives.
Summary: Key lessons from the different measuring tools
- The tools are anchored to higher level goals, primarily UN SDGs. Most look well beyond narrow ‘development outputs’ to consider wider economy, community, sustainability, health and quality of life aspects within their goals. Indicators for these provide a common reference point.
- The outcomes are not arbitrary, generic or top-down – they are specifically derived to address the issues and goals sought for the place, neighbourhood or building.
- These toolkits are generally set up to capture a measurement at a specific moment in time. The exercise needs to be repeated longitudinally to track trends of change and understand impact.
- A manageable number of outcomes are tracked. This ranges in number from 9 -21 per theme/category, with an effective number seeming to be around 14 – 15.
- Multiple indicators can be used to measure each outcome. Provided there is a relationship to the outcome/goal, the indicators can change to suit national/regional/local circumstances and data availability.
- Matching the right indicators to the right outcomes can be cautiously reverse engineered, based on available data. The caution is linked to limiting only to what is available, to avoid extra workload. This may need to be built up over time if new data gathering is required.
3.5. Focus group key messages
A series of online Focus Groups was undertaken following development of the draft toolkit with one held in each of Wales, Scotland, Ireland and England. The Focus Groups were shaped around ongoing lines of enquiry. While each geographical jurisdiction raised its own distinct set of messages, the following eleven key points were common across all of the Focus Groups.
A tool in the right direction
- Going beyond current metrics is desirable. The measurement of speed and number of applications does not provide an indication of the real impact that planning is having in a local authority area, nor at regional or national levels.
- A pragmatic pathway is required that starts with the current ‘position’ and information of planning authorities, reducing the need for additional data collection that isn’t already available in their own, or partners’, systems.
- Measuring what is happening on the ground in real places is key to understanding whether policy is having an impact – the tool needs to do this, or it will result in more of the same. Strategy and policy implementation are what is being measured – as there can be good policy but, without implementation, its impact is not realised.
- Tracking the right data sets over time will help to provide ‘read back’ on whether planning has had an impact; there is a need for consistency of measurement and process over these timescales to ensure accurate, comparable measurement.
- Guidance from governments on what should be measured would be welcome.
- Planning has a diminishing role once a planning application has been determined. There is a need for planners to make a big impact where they can in the process, and ideally to also remain linked to development post-decision. The practitioner skill, experience and judgement are key, notably in development management.
Areas for improvement
- Expansion of any monitoring role is not considered possible in planning authorities, given current resource levels – this would only be possible with further investment. This was a key concern from almost all who participated. They recognise that monitoring is already limited to what is absolutely necessary and additional monitoring would be very difficult to provide.
- Monitoring by an external party – such as Audit England, Office of the Planning Regulator, Regional Assemblies and the Department for Housing, Local Government and Heritage (DHLGH), (both Ireland) or the Planning Co-ordinator (Scotland) was advocated to ensure a degree of objectivity and address internal resource constraints within local authorities. The impact on behaviour/practice by such independent review needs to be acknowledged, as it could have a beneficial impact in altering outcomes.
Benefits
- The tool can be used to communicate with Chief Executive and Cabinet level in local authorities and other partner agencies, helping to monitor and align place-based decision making and assist the drive for a better place outcome.
- Making the case for appropriate resourcing – the tool can be used to aid identification of what and where specific needs arise. Rather than campaigning for more planners, a targeted business case can be made for a specific skill or expertise.
- Embedding the toolkit within the plan-making process, ideally at the outset of a new cycle of plan preparation, would provide a consistent method for ensuring impact can be properly considered throughout the formulation and implementation of a new plan.
3.6. Pilots and contextualisation
The pilots were run during the latter stages of the Covid-19 lockdown. They were conducted through a series of video calls, and the process of piloting was developed in partnership with the pilot areas. It was acknowleged that piloting would require simulated use of the toolkit given that the available timeframe and resource was restricted (and exaercabated by circumstances). Therefore the focus of the pilots was around the functionality of the diagnostic stage. The pilots provided insight to the team on the function of the toolkit and the role it can and should play in plan development and measuring of planning outcomes. We are very grateful to all those that participated and gave generously of their time.
3.7. Scotland context and pilots
In the next iteration of Scotland’s National Planning Framework 4 (NPF4)28 – there is a set of high-level outcomes:
- Meeting the housing needs of people living in Scotland including, in particular, the housing needs for older people and disabled people.
- Improving the health and well-being of people living in Scotland.
- Increasing the population of rural areas of Scotland.
- Improving equality and eliminating discrimination.
- Meeting any targets relating to the reduction of emissions of greenhouse gases.
- Securing positive effects for biodiversity.
This aligns with Scotland’s National Performance Framework, its expression of outcomes for the nation, and is tied to the UN SDGs. Within this there are two specific spatial outcomes articulated:
- NO 10: We live in well-designed, sustainable places where we are able to access the amenities and services we need.
- NO 12: We value and enjoy our built and natural environment and protect and enhance it for future generations.
The ‘non-process’ parts of planning are noted here, planning should be delivering quality, sustainability and ultimately better life outcomes through access to what we need. The current measurement of planning is heavily focused on process and not these attributes of the planning system. Previous research recommendations have suggested monitoring comes through an evolution of the Planning Performance Framework (PPF). This currently relies heavily on case studies.
Using the PPF and Annual Monitoring Statements helped set up a baseline run of the toolkit to pilot with the following authorities:
Highland Council
Based on the 2012 Highland-wide Local Development Plan. Pilot simulating an end of plan review.
Loch Lomond and the Trossachs National Park Authority
Based on the Loch Lomond and the Trossachs National Park Local Development Plan 2017 – 2018. Pilot simulating a mid-term review.
North Lanarkshire Council
Based on 2012 North Lanarkshire Local Development Plan. Pilot simulating an end of plan review.
City of Edinburgh Council
Based on 2016 Edinburgh Local Development Plan. Pilot simulating an end of plan review.
3.8. Key lessons from Scotland pilots
The following section provides a summary of the headline learning points drawn from the participants in the various pilot sessions.
The Highland Council
- The tool will be useful as an evidence base supporting current monitoring of effectiveness of policies in different geographies in Highland (very diverse local authority over a very large area).
- It aligns with current thinking to ensure that the Local Development Plan and all other strategies, whether top down or bottom up, are all pulling in the same direction.
- Aim is for every public investment to be making progress towards agreed outcomes – if the plan has this tool and process embedded it can help to deliver this.
- Data should be playing a new, stronger role in plan-making and monitoring. The role for data can be to assist in the evidence base for policy, and around supporting key planning decisions and asset management.
- Very important that Building Standards data should be drawn upon – it is accessible in Uniform (software system used by Scottish Local Authorities, provided by Idox) but the connections between planning permission and completion certificates still need to be made to close the evidence loop.
Loch Lomond and the Trossachs National Park
- The toolkit helpfully flags up what is not being monitored or looked at. Some of this can be accounted for by areas where there is not much development activity, but others suggest that policies may not be applied or used quite as intended. There is a process currently where the Development Plan and Development Management teams discuss policy, and this can provide an evidence base for these reviews and inform decision-making.
- Data for the National Park is complex, as many of the data collection geographies do not directly align with the National Park’s boundaries. Therefore finding data around some impacts will require additional work, either around understanding how existing data can be used, or gathering new data.
- It is crucial that there are good processes behind this measurement process, as with any monitoring. A good database, with helpful guidance notes are needed to ensure data gathered in a robust and credible manner.
North Lanarkshire Council
- A challenge remains around the attribution of some impacts to planning – how direct does this link need to be?
- The tool can assist in the alignment between the different plans for North Lanarkshire, including Single Outcome Agreements, Local Outcome Improvement Plans and Local Development Plans. These should be drawn together and all be pulling in the same direction.
- If policy or data inputs are too generic it may not be possible to track the performance. For example, policy on design quality that applies to the whole area can be very tricky to monitor. It may be easier when it more place specific.
- The tool provides an example of how national metrics might help. For instance, for 20-minute neighbourhoods (part of the Scottish Government’s policy agenda), a set of building blocks of what makes a good one could be articulated nationally, with performance tracking data collected locally.
City of Edinburgh Council
- The volume of information in the toolkit could and should be carefully whittled down and targeted. Not everything that is measurable needs to be included to demonstrate planning is contributing to outcomes.
- The tool can provide an important cultural/behavioural role within planning departments – if Development Management begins to build a sound evidence base from their decision making, it can build morale behind a shift towards an outcomes focus.
- To tool will help in formulation and developing of agreed, relevant performance targets.
- The process and tool can provide a comprehensive pulling together of plan and monitoring in one location. This gives a new insight, quickly identifying areas for further review.
- This could provide an important shift in the mindset, away from process and timescales, towards thinking about outcomes and impacts.
3.9. Ireland context and pilots
Ireland’s planning policy and administrative system is hierarchical in nature with the National Planning Framework’s national strategic objectives feeding into objectives of the Regional Spatial and Economic Strategies and then into the development plans of Local Planning Authorities.
Local Authority Performance Indicators have been developed by the National Oversight and Audit Commission (NOAC) established under the Local Government Reform Act 2014 and which can be deemed output indicators at the local level. The OPR is working with NOAC, the Department Housing, Local Government and Heritage and the wider local authority sector to develop a more comprehensive set of statistical indicators with which to oversee the performance of the planning authority sector. This expanded set of existing and newer indicators and sources of management information will be incorporated into the PPAF and will potentially include outcome indicators. At the current stage of development of PPAF, indicators will sit within one of three thematic categories: 1) Plan Led Development; 2) Managing for Sustainable Development; and 3) Delivering Quality Planning Services.
Currently, the implementation of local authority development plans is monitored through statutory monitoring reports and through Strategic Environmental Assessment (SEA) monitoring.
The pilots selected for Ireland reflected its hierarchical system of policy formulation and administration. The pilots also considered rural and urban contexts, different stages in the plan preparation cycle and sector specific spatial plans. Those selected for the pilots were:
The Regional Spatial and Economic Strategy for the Eastern and Midland Region 2019-2031
The pilot was at the start of the plan with a view to establish a monitoring regime.
The Donegal County Development Plan 2018-2024
The pilot was stimulating a mid-term review and it was used as a mechanism to inform the content of the next plan.
Clare County Council Wind Energy Strategy 2017-2023
The pilot was at the end of the strategy and it was used as a mechanism to inform the context of the new strategy.
Sandyford Urban Framework Plan 2016-2022
The pilot was at the end of their plan period and it was used as a mechanism to inform the content of the new plan.
3.10. Key lessons from Ireland pilots
Clare Wind Energy Strategy
- The toolkit helps us to rethink and re-evaluate the plan-making process and post-plan-making. It forces greater consideration of monitoring.
- Three people with different backgrounds carried out the scoring process, as it can be subjective and planning outcomes can mean different things to different people. The process of scoring was found to be as important as the score itself. The team review helps working toward a consensus and necessitates a dialogue to get to the score. The process is more important and it is at the heart of the purpose of plan-making.
- A standard set of indicators should be collected to feed back to regional level and national level. This would also help monitoring efforts, particularly with comparability of performance.
- Policies should be specific and measurable. Measuring more subjective policies will be more difficult.
- Relationship with strategic environmental appraisal (SEA) should be noted – in terms of purpose and type of data collected.
Sandyford Urban Framework Plan
- There is a nuance between outputs and outcomes. This process helps us reflect upon it.
- The themes give rise to quite a bit of crossover, in terms of where policies or indicators might lie.
- Scoring can only be done if the data to measure outcomes is readily available. It is easier to measure/score quantitative policies and objectives as these are either achieved or not achieved. It will be more difficult for assessing more qualitative policies.
- The toolkit might need to focus more on the strategic and ‘big ticket’ items to gauge impact, and see what datasets are available to support this. It is currently too detailed.
- The thematic approach can nevertheless assist monitoring and evaluation of different sectoral impacts. So it can add value.
Donegal County Development Plan
- This would be a useful tool to discuss the effectiveness of policies and objectives with elected members.
- It will be useful to help prepare plans which are concise, more readable, more focused, more pragmatic.
- The toolkit should be adaptable to a degree, and it could be used to draft development plans and contribute to their subsequent monitoring.
- Scoring would need to be carried by a team, including a range of disciplines, not simply planners ‘marking their own work’. Consideration might be given to having external assessment.
Eastern and Midland Regional and Spatial and Economic Strategy
- The toolkit is useful to measure the impact of policies further down the line in any timeframe, to see whether what these are trying to achieve has had any effect. It provides a reflection on policy-making and is also useful to measure progress on the delivery of specified objectives.
- Scoping the number of policies and objectives for review could be considered, as the task could be resource-hungry if it has to carried out across all 8 themes.
- Scoring could be carried out at several stages of plan-making, either at review stage or when starting out the next plan. We think collective scoring would be advisable and it is acknowledged that external scoring may be more robust as it is may be more objective.
- An element of coherence of input at lower level is necessary to be able to measure at higher level. To that effect, common indicators would be useful and these should be linked back to the National Planning Framework.
3.11. Wales contextualisation
The Measuring What Matters: Planning Outcomes toolkit in a Wales context is a mechanism to link national wellbeing goals and indicators, and national sustainable placemaking outcomes, with the review of Local Development Plans.
The Well-being of Future Generations (Wales) Act 2015 defines a series of goals, linked to a definition of sustainable development, and sets out methods of working towards these goals. Planning Policy Wales Ed.10 aims to maximise contributions to these goals by (1) promoting the concept of placemaking and (2) defining a series of ‘national sustainable placemaking outcomes’. Planning Policy Wales translates the well-being goals and ways of working into the planning system. There is nevertheless a need to strengthen how national planning policy connects with the practices of Local Planning Authorities.
The Welsh Government planning performance framework focuses principally on Local Planning Authorities and on process and efficiency indicators. Local Planning Authorities also issue their own Annual Monitoring Reports as a means of evaluating the implementation of their Local Development Plans. Reviews of the effectiveness of Local Planning Authorities raise some important concerns about how well they are connecting with the well-being agenda and goals. There are also significant concerns about the capacity of Local Planning Authorities to address this due to available resources. There has been work conducted in Wales in demonstrating the value of planning in Wales and this has attempted to align with the well-being goals.
Fuller contextualisation material for Wales can be found in the Measuring What Matters – Toolkit for Wales document.
3.12. Key messages from Scotland and Ireland pilots
The pilots allowed for a testing of the concepts, definitions and spreadsheets which underpin the toolkit. The spread of pilots covered different jurisdictions, spatial scales, geographical areas and types of plans. The following common practical lessons emerged from the pilots:
Different use depending on plan cycle
Several pilots were able to use the toolkit as a reflective plan-making tool utilised at the start of plan preparation, while others found it useful for mid-term monitoring of policy implementation.
Clear Understanding of Definitions
There is a need for a clear understanding of the distinction between outputs, outcomes and evaluation. Moving from measuring outputs to outcomes involves more qualitative assessment, which nonetheless should still be aligned to a robust baseline and which is capable of scoring and evaluation. If the toolkit is used at the start of a process as a plan-making tool, desired outcomes effectively become targets.
Providing a clear single-view of policy and monitoring
Drawing together plan, monitoring and performance material into one location in a comprehensive manner proved to be useful in diagnostic use. Highlights of where a plan or issue achievements are, or where there are gaps, can quickly be identified at this higher level. When going into more detail, the level of information becomes overwhelming. At the outset of toolkit use, it seems to be necessary to undertake this comprehensive exercise to identify what indicators and data sources provide a useful read on achievement in subsequent cycles. This process could also help to identify more clearly common and consistent indicators.
Extent of policies and objectives under review
Local development plans will include a wide range of policies and objectives. The resources will not necessarily be available to measure and evaluate the outcomes of all these provisions. A screening exercise can be undertaken at the start of the process to consider which key policies/objectives should be assessed. Due regard should be had to the requirements of monitoring and measuring outcomes at higher levels within the policy hierarchy. Consideration of the spatial application of the policy or objective should also be considered.
Developing an evidence base
The toolkit would be useful as an evidence base for more objective/scientific decision making. The connection between policy and monitoring demonstrates the effectiveness or otherwise of policy and its application. Understanding this relationship and the function of applying policy in creating good places that contribute to positive outcome will lead to better informed decisions. As the tool is used over time, a body of evidence will build of both qualitative and quantitative data that can be used for decision making. With delegated decisions, development management planners should see their role not as process but as contributing to outcomes. For elected members, decision making can be evidence based. In time, one could imagine that only good planning decisions are being made – based on the assumption that the outcomes being aimed towards are good. This is because such an evidence base of what planning decisions lead to good outcomes is developed. This is not to say that planning should be formulaic, but that lessons become properly embedded rather than held and applied by certain planners in certain places.
Connections between plan/policy-making and development management
Review and alignment between plan/policy-making and development management, this link ensures that the evidence base is continually developed (through inputting of data) and the above role from process to outcome focus is maintained. This is undertaken in some form by all the authorities that took part in the pilots, but not in a formal evidence-based manner.
Aligning and categorising with higher level objectives
The toolkit has eight themes, which are aligned to UN SDGs and national higher level outcomes. An exercise in allocating plan objectives to themes is required, acknowledging that some themes may be more important than others for a particular plan.
Selection of Indicators
Careful thought needs to be given to selecting appropriate output and outcome indicators which should be aligned appropriately with the objectives to be evaluated. Impact indicators are likely to be more qualitative in nature, but should still be capable of measurement. Consideration can be given to common indicators that can be used to evaluate the effectiveness of higher-level policies and allow for comparison between Local Authorities. Other indicators selected can be used for tracking improvement over time by comparison with previous performance of an objective/policy.
Attribution versus facilitation of conditions
Planning cannot take direct attribution for improving people’s health or economic outcomes, or direct action on reducing carbon emissions. What planning does is facilitate the conditions in many instances for improving health, the environment and societal outcomes. Different evidence bases can tell us what the outcomes are from the development of open space, active travel routes and good quality housing as examples. Planning plays a role in planning and granting consent for these, thus facilitation and creation of the right conditions.
Data sources and baseline
Careful consideration of data sources needs to be given in the selection of indicators, as measurement needs to be consistent and facilitate comparison. These indicators should be connected to a strong evidence related baseline. Preferably, the exercise of indicators identification, data sources and baseline should be scoped and defined at the start of the plan cycle to allow for the necessary and efficient collection and collation of data.
Evaluation
Any evaluation involves an assessment, including scoring of performance. This scoring can be done either externally, or internally. If undertaken internally, processes to avoid undue bias should be considered and these can include a panel of assessors, including possibly an external contributor.
Refinement of Toolkit
There were several very constructive suggestions for improvement of the toolkit and associated spreadsheets (e.g. summary assessment of theme, streamlining, presentation) which have been taken on board in the formulation of the final version.
4. The toolkit concept
4.1. Developing a toolkit
Previous work measuring the impact of planning has often fallen short of delivering specific measurement. This may be because the leap of ambition is too great a step to make from the way planning services are currently measured, including in relation to attribution of causality (is planning really responsible for certain outcomes?). There is a need therefore to create a tool that can build up from current planning authorities’ practice and data towards a fuller evaluation of the impact of planning. Sketching such a pathway can help planning authorities position where they are with respect to their level of monitoring process and what requires improvement. Measuring planning outcomes, certainly at its most ambitious level, requires robust performance management systems to be in place. This should not be overlooked, as the ineffective measurement could lead to less effective performance improvements and weaker outcomes.

Figure 10: The eight themes by which performance data is tracked in the toolkit
4.2. Outcomes – defined at plan level
An exercise in drawing together the aspired outcomes articulated in the respective planning regimes of Ireland, Wales and Scotland resulted in a rather unsatisfactory ‘lowest common denominator’ aggregation of outcomes, not capturing the aspirations of any of these governments. Having a set of outcomes arrived at in this ‘pooled’ manner could potentially undermine the aims of each jurisdiction’s strategy and policy content. While they are all anchored in the UN SDGs, there is a need to retain the distinctive way each jurisdiction has sought to pursue these outcomes. In this context, and following review with a range of specific authorities, it is considered the outcomes are best defined at the geographic specificity of the plan level, whether national, regional or local, albeit with the inclusion of key nationally consistent indicators included within those.
This definition of outcomes also reinforces another important aspect of the toolkit, which is its use in measuring policy effectiveness. By having outcomes directly tied to the planning authority and its plan the toolkit has a specific and connected purpose.
The scope and content of the outcome/impact monitoring framework will be determined by each jurisdiction, but we have identified some common features. We have developed a generic framework based on three key elements and three levels of sophistication:
- Linked national, regional and local policymaking-making to establish the hierarchical framework (the context – illustrated in the toolkits for Ireland, Scotland and Wales).
- Monitoring the delivery of core planning services, focusing on inputs, activities and outputs (Level 1 - outputs) and on outcomes (Level 2 – development outcomes).
- Monitoring and evaluation of the contribution of planning to place quality and place value (Level 3 – impact).
As this process is applied, the toolkit also allows for a feedback loop to develop. Figure 11 below sets out the elements, levels and feedback loops.

Figure 11: Levels of complexity of impact monitoring
4.3. Toolkit theme categories and indicators
We have reviewed many options for categorising the toolkit themes and have resolved on eight, each of which would have their own set of indicators that address national, regional and local policy outcomes. These thematic categories are:
- Place Quality – Design and People
- Health and Wellbeing
- Environment – Conservation and Improvement
- Climate Change
- Homes and Community
- Economy and Town Centres
- Movement
- Engagement and Service
The specific indicators within each of these categories would be drawn from a range that
- Relate to national, regional and local policy and performance circumstances.
- Allow for progression up through levels – level (1) relates directly to planning activity such as plan-making, permissions granted, etc; level (2) to development delivered; level (3) to more ambitious targets evaluating the direct and indirect impact of planning on a wider range of outcomes.
Initially the indicators will be derived from data that local authorities or partner agencies are already gathering.
4.4. Data sources
There is a set of principles that apply to the selection of indicator data. They must be:
- Specific and must directly relate to outcomes.
- Easily understood by the general public.
- Measurable, implying that indicators must be either quantitative, or, if qualitative, must be interpreted into quantitative values (i.e. have a related ordinal scale).
- Useable at different phases in a plan’s life cycle - preparation, mid-term and end-term so able to reflect changes over a period of time.
- Responsive and sensitive, clearly changing as circumstances change at appropriate scale and easily updated.
- Able to reflect the multi-faceted nature of planning and its contribution to outcomes. For example, new development has an impact on delivering homes, quality of life, environment, carbon and movement.
- Clear and controllable, relatively straightforward to collect and use as an indicator.
There are already many existing data sources. We have undertaken a data mapping exercise for Scotland and Ireland (Appendix B) that has tracked down data sources against suggested indicators from the survey. What the exercise has shown is that there is a vast data resource to draw from, but that work needs to be done to select the right indicators to monitor the planning performance, outputs and outcomes.
4.5. Scoring
A method of comparative scoring is needed to give an indication of achievement against objectives that can be read across policies, plans and the eight themes. When it comes to scoring there are two critical questions:
- What is the scoring measured against?
- What action results from the score given?
To provide such comparability, the scoring is based on a five-level ranking, each with performance benchmarks and proposed actions.
In measuring outcomes, the scoring needs to assess realistically whether or not a plan is delivering against any given aspired policy outcome. For example, the extent of progress in steps the plan is making towards achieving development in sustainable locations.
As to the second part, the performance score also indicates some action in the next step of the process. The scoring therefore identifies where resolution and implementation is required.
For this toolkit we have adopted an achievement scoring system of 1 – 5, as shown below.

4.6. Review
The toolkit is intended to be used in more than one full evaluation cycle, embracing monitor, review and application of the learning. Only by cyclical repetition of the process with a critical review at the final stage in the process, can improvement be tracked and delivered.
The process is set up to ensure that the basic building blocks are in place to assess impacts, address issues and improve performance.
The key elements of the review stage are:
Review the assessment
- Are inputs being monitored?
- Are activities and outputs being monitored?
- Are development outcomes being monitored?
- Are place impacts (quality and value) being monitored?
- Does the scoring indicate strong alignment with local/regional/national plans and National outcomes?
- Are Key Performance Indicators, SMART targets or other markers being established where needed?

Figure 12 Handbook: Aligning and Setting Targets
Resolve issues arising
- Inputs[45] – what data needs to be captured to monitor effectively?
- Activities and outputs – what data needs to be captured to monitor effectively?
- Outcomes – what data needs to be captured to monitor effectively?
- Impacts – what data needs to be captured to monitor effectively?
- What policy areas need to be developed to create stronger alignment with local/regional/national plan and National outcomes?
Implement actions
- Develop policy to align with local/regional/national plans and national outcomes.
- Develop objectives and targets that can be measured.
- Identify existing data to begin monitoring.
- Identify future data requirements.
This completes a feedback loop of any one cycle and feeds into the next cycle of monitoring. Potential indicators and data sources for progression to higher levels of performance, including national and international, are provided in Appendix B of the research report, although this is indicative.
4.7. Visualisation of the toolkit results
Communication of the measurement of the outcomes and impact is a key part of the process. While the tool is being used to reflect and improve an outcomes-focussed approach, the measurement of achievement of the outcomes is critical for engaging other audiences.
By aggregating the scoring in each of the themes it is possible to create a graphic that quickly communicates the level that the plan (or theme, or place) is currently performing. Depending on where this information is being published there are two options for this. Below are radar (shown with an aggregate score) and linear charts (with no score) – it is important to note that there is no relationship between each segment, this is purely about graphic representation.
These graphics can provide quick ‘easyread’ feedback on the impact planning for a specified plan, area, policy. This can then be used to identify areas where action may be required.
 As both forms show, performance can be linked to the UN SDGs and also to a range of national objectives or outcomes.
The circular ‘radar’ diagram scores performance from the inside (low, under-achievement) outwards to the outside (excellent). It is useful for communicating online, in presentations or other instances where early visual impact is important.
The linear ‘graphic equaliser’ diagram can be more nuanced for formal reporting and other uses where space and visual impact are not at a premium.

Figure 13: Linear graphic representation with no scoring shown
5. The toolkit in practice
5.1. When to use the toolkit?
The toolkit can be used as a reflective analytical tool at the start of a plan or policy preparation process. The review of a pre-existing plan/policy can demonstrate the impact that the plan/policy has had over the course of its life. The performance review can also provide an evidence base for what needs to be adjusted in any new/update plan/policy or in development management decisions.
The tool is to be used in an overall monitoring cycle, with diagnosis, review and implementation built into its process. For a development plan this would include a baseline stage, mid-plan review and review ahead of the next iteration of the plan.
Other timeframe applications are possible and could be subject/theme specific. To review the relationship between adopted policy and development management decisions, for example in relation to climate change, decarbonisation or health and well-being.
Another use may be to refine a plan mid-cycle. The climate emergency and Covid-19 crisis flag up that action needs to be taken immediately and planning can play a critical role in this without waiting for the formal process of creating a new plan. The tool can help review existing performance and identify areas where additional guidance or mid-plan policy adjustment may need to be made.
The tool would also make an excellent basis for comprehensively assessing determinations made through the various appeal systems. This could provide an important transparent evaluation of such decisions and the degree to which they comply with local and national policy.
It is envisaged that, at least initially, the primary users of the toolkit will be planning authorities, along with performance monitoring colleagues in both national and local government. Initial use of the toolkit builds upon existing data and material. To be effective in building up data coverage and analysing performance across wider sectors will require input from economic development, environmental and health agencies, so they will also be contributors, users and potential beneficiaries in tracking the planning contribution to their strategies and goals, using the toolkit in an integrated approach to place.
Once the toolkit and data are available, we can see a wider range of beneficial users including
- Citizens, civic groups, residents and business stakeholders within an area who need to measure place-based outcomes (for example for funding reporting).
- Developers, investors and consultants behind key masterplan and development projects, looking to ensure that their proposals are outcomes-based and compliant with wider aims.
- Researchers such as universities, professional bodies and even the local and national media (consider interest in Covid-19 statistics).
- New cross sectoral planning partnerships – e.g. public-private or non-governmental organisations – as basis for tracking new plans and strategies.
To optimise the range of beneficiaries once established, it will be important that all material is publicly available across all indicators. Following this, almost anyone with the inclination could pick up the toolkit and undertake an assessment of the impact of planning in their area. In much the same way that the Place Standard tool has wide application, the Measuring What Matters toolkit could be of interest to community groups and school students -e.g. of geography or public policy.
5.2. What are the benefits of using the tool?
The utility of the toolkit and the ‘results’ arising from its use will include:
- Tracking performance/progress over time.
- Integration across policy sectors and themes.
- Understanding what has worked, what has not worked; identifying possible causes and what needs improving or abandoned in future.
- Informing development management and decision-making.
- Raising aspiration towards delivering better planning outcomes against strategies/plans/ policy goals.
- Visibility/transparency of outcomes and impacts at local levels.
- Aggregation and benchmarking of performance at regional and national scales.
- Raising shared factual/scientific awareness between different parties and stakeholders.
- Educational dimension in terms of knowledge transfer, skills and awareness/use of data.
Using the toolkit can be broken down into the following five steps:
Step 1 – Scoping exercise
Setting up the toolkit involves addressing a number of key issues.
- Identify clearly what planning policy is to be considered and define the spatial, temporal and policy extent to be assessed and what stage the policy is at in the cycle.
- Consider the purpose of assessment or survey being undertaken (e.g. mid-term review of policy, thematic review, advocacy, plan-making tool, establishment of a performance measurement system with identified monitoring requirements.)
- Understand and review the current position in relation to existing processes and systems for monitoring, measuring, evaluating, feedback and review with reference to activities, outputs and outcomes.
- Preliminary consideration of whether existing policies are delivering quality outcomes and if there is a clear pathway from vision to objectives to targets in the current plan.
- Consider how the toolkit will be used with reference to the means of identifying activities and selecting indicators to measure outputs and outcomes, in addition to a consideration of methods of scoring, evaluation and feedback.
- State other assumptions underpinning the use of the toolkit.
- Establish project team and agree procedures to carry out the assessment, which may involve internal and external evaluation to avoid undue bias and integrate views of stakeholders.
- What is in place that ensures the basics are being done?
- What is in place that assists in quality being delivered?
- Is there a clear pathway from vision to objectives to targets in the current plan?
Step 2 – Collation of data
This step requires the undertaking of a series of sub-tasks.
- Select the policies to be assessed, bearing in mind that it may not be possible to consider all objectives or spatial areas covered by the policy or practice, and there should be a focus on those of strategic importance that may inform assessments in other levels within the planning policy hierarchy.
- Assign selected policies to thematic subjects, and it should be noted that themes may vary in relevance depending on the nature of the policy or practice being assessed.
- Identify output and outcome indicators, drawing together all data sources around monitoring of individual policies/objectives/targets as such indicators may facilitate benchmarking with previous performance.
- Ensure that data is drawn from robust and reliable data sources and identify primary data collections sources, as required and resources permitting.
- Ensure a common baseline for data with reference to national indexes, or baselines that are set as part of the monitoring systems which are put in place. This should include:
- Assigning into thematic subject areas.
- Aligning objectives, policies and targets with monitoring data.
Step 3 – Diagnostic review
Once gathered, a review of policy, objectives/targets and the data is required. This needs interpretation and identification of actions, if required. Planners should be well equipped to undertake this type of evaluation, with reflection on intent and impact being a key aspect of this review.
- A qualitative assessment can be provided in relation to the policy considered, complementing the score, which may include follow on actions in terms of review or amendment of policy.
- Gain an overall understanding strengths and weaknesses in policy.
- Understanding gaps – is it due to low activity in that policy area or is there an issue in how the policy is implemented?
- Remember what/where assumptions have been made in Step 1.
Step 4 – Assessing impact
An integral part of the assessment process is achievement and impact scoring.
- Scoring and evaluation can be undertaken in several different forms, including internal, external and team assessments. Balance and objectivity should be central to the method adopted to avoid bias to ensure a realistic assessment of outcomes.
- Relative to target/objective what does the data tell about achievement? Assign a score of between 1 and 5 based on the scoring performance benchmarks.
- Actions relating to the scoring drawn from the assessment, but moderated for impact.
- Aggregate scoring per theme allows for visualisation and presentation of findings. Consideration may be given to weighting of different policies depending upon their strategic importance. For example, policies around climate change and their implementation may be prioritised and given a heavier weighting.
Step 5 – Review Resolve Implement
An overall review of the effectiveness of the policy is the final step.
- Review of the strengths and weaknesses of the policy document as a whole.
- Consideration of how policies align with higher level objectives.
- Review of effectiveness and outcomes of the policy, and if the policy is working.
- Is there a requirement for a policy review, amendment or new targets?
- What are the next steps, including an implementation plan?
- Is there specific monitoring required, with additional data gathering requirements?
- What are the lessons learnt for the assessment process itself?
- Review objectives and consider how these align with higher level objectives.
- Review the policy’s effectiveness.
- How do you know policy is working? - review targets.
- Implementation plan – how will next plan consider impact.
- What data should be included in the monitoring?
6. Recommendations
The toolkit was developed as a common framework in consultation with partners and participants from across Ireland and the UK. However, we recognise that while we have undertaken a good degree of contextualisation for different jurisdictions, detailed operational context matters. The research project did not include the opportunity for piloting the toolkit in Wales, England or Northern Ireland.
As the toolkit stands it is ready to be used but, from our work so far within the constraints of the Covid-19 pandemic, it needs refinement to become more robust, further appreciating what does and does not work from different user perspectives. We consider more is needed to develop the toolkit for wider application, not only in Scotland and Ireland where more testing has been done, but in the other jurisdictions too.
We suggest that the following steps could be explored by the RTPI, the national planning jurisdictions (like OPR) and professional officer bodies (e.g. Heads Of Planning Scotland (HOPS), Planning Officer Society Wales (POSW) and Planning Officer Society, England (POS)) to further support the identification and measurement of planning outcomes:
- Undertake a set of specific pathfinder pilots with invited planning authorities alongside partner and civic bodies in Ireland and Scotland, linked to their respective national performance outcomes. This would help to build knowledge around taking steps towards narrowing down the number of indicators required to measure the impact of planning.
- In all jurisdictions, further develop and refine the direct linkage and relationship between planning, placemaking and the cluster of ‘place-based’ national and international indicators[46]. Developing these linkages and the hierarchy will provide a clearer manner in which to measure impact and support streamlining of both the toolkit and other monitoring processes. From this consolidating current monitoring with the toolkit could be considered.
- In each jurisdiction, develop and confirm a series of measures and indicators, agreed between stakeholder parties, connecting planning to each of the national performance placemaking outcomes and the UN SDGs.
- A deeper understanding of the data available should be developed. While the data mapping shows there is material in existence, it needs to be checked for appropriateness, quality, time and spatial elements to ensure that it would be presenting the right information.
- Move to a digital platform to enable the toolkit to be integrated with other agencies, data sets and potentially GIS. This would help realise its ability to serve as a corporate tool.
- Undertake independent review of the performance, efficacy and lessons regarding the pilots(1), relationships(2) and indicators (3) to ensure the process and toolkit delivers a useful assessment of progress. A verification process that can check that the toolkit is operating as intended across multiple users would be needed, and to implement any lessons learnt from this wider use.
- Arising from this further development and testing, revision and update of advice and guidance to local planning authorities within each jurisdiction (e.g. Welsh Government Local Development Plans Manual or equivalent) explaining the shift towards evaluation of wider planning outcomes rather than the monitoring of outputs and policies.

6.1. Conclusion
There is no final end state to be arrived at as the toolkit is part of the ongoing evolution around the measurement and evaluation of impact. The flexible, adaptable nature of the tool – particularly its indicators as more data and higher measurement is possible – means this can continue to evolve. The tool introduces a method where learning is embedded and implemented in a cycle of improvement in addition to measurement. The toolkit therefore does more than just measure but has embedded a feedback loop that can help drive continual improvement towards outcomes-focussed planning.
Although the tool has been researched and generated for peer to peer usage within planning, it is clear that, once established, the toolkit has many potential applications, audiences and beneficiaries. By providing the basis to move towards, and progressively evaluate, a whole systems approach to planning and placemaking, it makes the connection between policy, decision making and the quality of outcomes in social, economic, health and environmental terms.
Because it can be used to track performance using open shared data, it can be used both as an objective evaluation tool and, potentially, as an integrative/advocacy tool within government and the corporate approaches of the public sector agencies.
It can also support the private and third sectors in developing higher performing placemaking in their investments, for instance in reducing carbon or improving health and wellbeing.
The toolkit affords the potential basis of monitoring and evaluating, and even repurposing planning in the public interest – rebuilding confidence in the system based upon actual performance, rather than hearsay and hyperbole.
Much therefore depends on the next stage of refinement and development, and ultimate adoption within different jurisdictions to suit their circumstances.
References / Bibliography
AlWaer, H., & Illsley, B. (Eds.). (2017). Rethinking Masterplanning: Creating Quality Places. ICE Publishing.
AlWaer, H. Bickerton, R. Kirk, D. (2014). Examining the components required for assessing the sustainability of communities in the UK. Journal of Architecture and Planning Research.
Alwaer, H., Bickerton, R., & Kirk, D. (2014). Examining the Components Required for Assessing the Sustainability of Communities in the UK Journal of Architectural and Planning Research, 31(1), P.1-26.
Al Waer, H. Kitson, M. & Croome, D. (2009). SuBETooL ( Sustainable Urban Built Environment Tool), framework and protocol for assessing sustainability. Developed with Hilson Moran and Reading University and put into practice by Hilson Moran in 2009. P100. This proprietary framework has been published internally by Hilson Moran, Husam Al Waer and Derek Croome (2009-present).
Cook, A. (2017). Outcomes-Based Approaches in Public Service Reform, What Works Scotland Position Paper.
Communities Scotland. (2007). Delivering Change: Understanding the outcomes of community learning and development.
Department for Infrastructure. Northern Ireland Planning Monitoring Framework. 2018-2019.
Department of Agriculture, Environment and Rural Affairs. (2018). United Nations Sustainable Development Goals mapped to Programme for Government Outcomes and Indicators: https://www.daera-ni.gov.uk/publications/united-nations-sustainable-development-goals-mapped-programme-government-outcomes-and-indicators.
Design Council for Wales. (2017). Places for Life.
Egan Review: Skills for Sustainable Communities. (2004). https://www.ihbc.org.uk/recent_papers/docs/Egan%20Review%20Skills%20for%20sustainable%20Communities.pdf.
Government of Ireland. (2015). Planning Policy Statement, https://housing.gov.ie. P.8.
Government of Ireland. (2018). Project Ireland 2040: National Planning Framework.
Government of Ireland. (2018). Project Ireland 2040 National Planning Framework. P. 13.
Government of Ireland. (2018). Project Ireland 2040 National Planning Framework. P. 12.
‘Le référentiel ‘Un aménagement durable pour la ville de Paris’ - Tool for evaluating the sustainability of urban places in Paris.
Métropole du Paris. (2008). ‘Le référentiel ‘Un aménagement durable pour la ville de Paris’.
OPR. (2019). Strategy Statement 2019-2024.
Pearce, J. Robinson, R. (2000). Strategic Management: Formulation, implementation and control.
Pearce, D. Barbier, E. (2000). Blueprint for a sustainable economy.
Planning Advisory Service. Monitoring that matters - towards a better AMR. April 2011.
Place Alliance. (2019). Place Value & the Ladder of Place Quality. It contains a useful summary of the evidence.
RIBA Sustainable Outcomes Guide: https://www.architecture.com/knowledge-and-resources/resources-landing-page/sustainable-outcomes-guide.
RTPI, D. Adams et al. Delivering the Value of Planning. August 2016.
RTPI, Vivid Economics. Invest and Prosper. October 2020.
RTPI. (2001). New Vision for Planning.
RPTI. (2020). Invest and Prosper: A business case for investing in planning.
RIAI. Creating Places for People: RIAI Town and Village Toolkit. May 2019.
Scottish Government, yellow book, Nick Wright Planning. (2018). Monitoring the outcomes of planning: a research study.
Scottish Government, Architecture and Design Scotland, NHS Health Scotland. Place Standard: How Good is Our Place? https://www.placestandard.scot.
Scottish Government, yellow book, Nick Wright Planning. (2018). Monitoring the outcomes of planning: a research study.
Scottish Government, NHS Scotland, Architecture and Design Scotland. Place Standard Tool, Strategic Plan 2020 – 2030. P 11.
Scottish Government. National Performance Framework. https://nationalperformance.gov.scot/what-it.
Scottish Government, COSLA. (2019). Place Principle.
Scottish Government. Planning and Architecture National Planning Framework 4. https:/blogs.gov.scot/planning-architecture/2019/10/08/national-planning-framework-4-the-essentials/.
Trained, P. (2011). The Bishop Review: The Future of Design in the Built Environment. Project Report. London: CABE.
United Nation. UN Sustainable Development Goals Icons. https://www.un.org/sustainabledevelopment/news/communications-material/.
Urban Analytics and City Science, Shahab, Clinch and O’Neill. (2019). Impact-based Planning Evaluation: Advancing Normative Criteria for Policy Analysis.
UK Government. (2019). Implementing the Sustainable Development Goals. https://www.gov.uk/government/publications/implementing-the-sustainable-development-goals/implementing-the-sustainable-development-goals--2.
Wales Audit Office. The Effectiveness of Local Planning Authorities in Wales. June 2019. P.8.
Welsh Government. (2019). Well-being of Wales 2018-2019. https://gov.wales/sites/default/files/statistics-and-research/2019-09/well-being-of-wales-2019-590.pdf.
Wong et al. (2007). Outcome Indicators for Spatial Planning in England – Framework Report. University of Manchester, Centre for Urban Policy Studies. P34.
Acronyms
AMR - Annual Monitoring Reports, England.
APR - Annual Performance Report, Wales.
DHLGH - Department for Housing, Local Government and Heritage, Ireland.
GIS – Geographic Information System.
HOPS - Heads Of Planning Scotland.
NOAC - National Oversight and Audit Commission, Ireland.
NPF – National Planning Framework, Ireland.
NPF – National Performance Framework, Scotland.
NPF4 – National Planning Framework 4, Scotland.
OPR - Office of the Planning Regulator, Ireland.
PMF - Planning Monitoring Framework, Northern Ireland.
PPAF - Planning Performance Assessment Framework, Ireland.
PPF - Planning Performance Framework, Scotland.
POSW - Planning Officer Society Wales.
POS - Planning Officer Society, England.
RIBA - Royal Institute for British Architects.
RTPI – Royal Town Planning Institute.
RSES - Regional Spatial and Economic Strategies, Ireland.
SMART - Specific, Measurable, Achievable, Realistic, and Timely.
SEA - Strategic Environmental Assessment.
UN SDGs – United Nations Sustainable Development Goals.
UK – United Kingdom.
Appendix A: Survey summary
The survey ran for 5 weeks from 27 March to 8 May 2020. The purpose of the survey was to gain an understanding of the functioning of current planning measurement systems, within the context of thinking about future planning outcome measurement. The survey was a mixed quantitative and qualitative survey.
This headline analysis provides an overview of responses to key questions in the survey.
Respondents:
- 121 respondents
- 50% planning authority
- 20% governmental dept/agency
- 10% third sector
- 10% private sector
- 10% private individuals
Direct and Indirect Contribution to UN Sustainable Development Goals
|
Planning makes a direct contribution to |
Planning makes an indirect contribution to |
||
|
3 |
Good health and wellbeing (80%) |
1 |
No poverty (67%) |
|
6 |
Clean water and sanitation (83%) |
2 |
Zero hunger (60%) [no contribution next highest] |
|
7 |
Affordable and clean energy (82%) |
4 |
Quality education (55%) |
|
8 |
Decent work and economic growth (73%) |
5 |
Gender equality (45%) [no contribution next highest] |
|
9 |
Industry, innovation and enterprise (85%) |
10 |
Reduced inequalities (54%) |
|
11 |
Sustainable cities and communities (94%) |
12 |
Responsible consumption and production (54%) |
|
13 |
Climate action (79%) |
16 |
Peace, justice, strong institutions (56%) |
|
14 |
Life below water (52%) |
||
|
15 |
Life on land (84%) |
||
|
17 |
Partnerships for the goals (50%) |
|
|
Do you have any suggestions for improving planning performance measurement in your nation/planning authority?
- Planning Performance measurement should move from measuring quantity to measuring quality. It should focus more on outcomes and less on process and outputs. Questionnaire and Surveys are a way of gaining qualitative data on planning outcomes
- Clear expectations set at National Level such as National Goals and the UN SDGs translated into tangible targets at local levels. It has to create a two-way relationship.
- Provide clear guidelines on how to improve and add value to development. These supposed to be consistent.
Do you have any suggestions for improving the monitoring of planning inputs and activities in your jurisdiction, for example, by filling gaps in the data collection process?
- Have meaningful indicators and common data parameters applicable across all types of local authorities. There should be more consistency.
- Dislocation between plan-making and development management. There is a need to connect these to get relationship between inputs and outcomes.
- “Quantify the inputs, qualify the outputs”. The idea is that there is need to shift from measuring quantity to measuring quality. To achieve that it would need to move towards 'qualitative' methods of data collection. The use of new technologies (Big Data, Artificial Intelligence etc.) might help to improve monitoring.
Do you have any suggestions for improving the monitoring of planning outputs in your jurisdiction, for example, by filling gaps in the data collection process?
- Use of completions data via building standards
- Monitoring mid-plan term – review what is outstanding
- Percentage of build out of zoned land
- Opportunity for tech/Big Data to play a role in making the connection
Do you have any suggestions for improving the monitoring of planning outcomes in your jurisdiction?
- Link the planning approval data with the building warrant data to allow the monitoring to be more accurate
- Quality of outcomes needs to be considered
- Resourcing is an issue for being able to improve monitoring. Additional resources are needed for a more robust post decision monitoring
- Have a more transparent process in place and mechanism for accountability at local level
- Authorities should have a specific role such as a monitoring officer for monitoring the implementation of development.
Performance Indicators for direct and indirect impact
- Wide range of indicators suggested as expected, can be categorised as:
- Hard data, drawn from planning/built environment (e.g., approvals, completions, air quality etc)
- Hard data, drawn from other sources (e.g., life expectancy, facilities access)
- Soft data – existing and new opinion data, seeking perception of places, satisfaction etc.
Does monitoring provide a clear and accurate picture of the inputs devoted to planning in your jurisdiction, and of the activities they resource?

Does the monitoring activity provide a clear and accurate picture of the outcomes of the planning system in your jurisdiction?

These two questions provide telling answers regarding the current status of measuring planning. To understand the impact that planning has on a place, there needs to be a clear understanding of the direct outcome (that is the development and use of land), let alone the impact of this on whether a good place has been created that contributes to quality of life.
The conclusion we can draw from this is that if the toolkit is to have an impact, it needs to begin from where planning authorities currently are in their measurement and not look to make a leap that results in inaction.
Appendix B: Illustrative data mapping – Scotland and Ireland
A high-level data mapping exercise was undertaken for Scotland and Ireland. This was based on the suggested indicators gathered through the survey. The indicators suggested were a mix of existing and aspirational. The purpose of the data mapping exercise was to search for data sources that aligned with these indicators in Scotland and Ireland.
This exercise demonstrates that there is existing data, but only serves as indicative. Further detailed work would need to be undertaken on the data to ensure that it is up to date, appropriate, robust and works at congruous spatial scales to what is being monitored.
Place – Design and People
|
Indicators - range from survey |
Data Source - Scotland |
Data Source - Ireland |
Level |
Relationship to planning |
|
Happiness Index |
Scottish Health Survey: Child Wellbeing and Happiness |
Growing up in Ireland (ESRI growingup.ie). and Ireland Regional SDGs 2017: topic 2.13 Suicide Mortality Rate by County and CSO SILC Module on Well Being 2018 |
3 |
Indirect |
|
Connection to/sense of place |
Scottish Household Survey: Perception of Local Area |
NOAC yearly Local authority Satisfaction Survey |
3 |
Moderate |
|
Social interaction |
Scottish Household Survey: Places to Interact |
|
2 |
Moderate |
|
No. community led projects |
National Performance Framework: Community Ownership |
Public Participation Network data. Community projects funded by other agencies: Sports Council, LEADER; Town and Renewal Schemes; An Taisce |
2 |
Indirect |
|
Crime rate |
SIMD: Recorded crimes of violence, sexual offences, domestic housebreaking, vandalism, drugs offences, and common assault per 10,000 people |
Central Statistics Office (CSO) - Recorded Crimes by offence and Garda station (quarterly data) and Regional SDGs in Ireland - Topic 7.3 Effect of anti-social behaviour on persons aged 18 and over, 2015 |
2 |
Indirect |
|
Educational facilities |
CHN10: Percentage of adults satisfied with local schools |
Growing up in Ireland: County Variations in the Outcomes of Children and Young People (ESRI, 2019) and Regional SDG Topic 3.4 Primary schools, pupils and teachers by county, 2016/2017 |
2 |
Indirect |
|
Demographics (spread = good) |
SIMD: Demographics |
Pobal HP Deprivation Index |
2 |
Indirect |
|
Awards |
RTPI, RIBA, SURF, SAQP |
RIAI/IPI/RTPI etc |
2 |
Direct |
|
Litter/vandalism levels |
ENV3c: Street Cleanliness Score; ENV7b: Percentage of adults satisfied with street cleaning |
Irish Business Against Litter survey; Tidy Towns reports. Pride of Place awards |
2 |
Moderate |
|
Noise Pollution |
|
Strategic Noise mapping - EPA/LA's; Local Authorities Noise Action Plan. No. of quiet areas (some authorities have created those)
|
|
Moderate |
|
Observed activity in urban environment |
Scottish Household Survey: Places to Interact |
|
2 |
Moderate |
|
Quality of public realm |
PPF Case Study: Quality of Outcomes |
Tidy towns may be used. Accident traffic rates / blackspots, air quality, congestion, number of s254 licences (for on-street seating etc) be taken together to provide a comment on the safety, usability or spaces? Also a lot of town centres have footfall counts data. Presence /use of CCTV and wifi are also good indicators of vibrant places |
2 |
Direct |
|
No. play/green spaces |
Town Centre Health Check data |
County Open Space strategies or Green Infrastructure Strategies |
2 |
Direct |
|
No. of retail units /leisure use in centres - vibrancy |
Town Centre Health Check data |
Retail Health Check (as part of Retail Strategies) or Town Centre Health Checks; Retail vacancy rates - Geodirectory/Valuation office data |
2 |
Direct |
|
Urban design evaluation |
PPF Case Study: Quality of Outcomes |
|
2 |
Direct |
|
Public realm schemes completed |
Planning consents |
Part 8 and Local authority Part 10 applications implemented |
1 |
Direct |
|
Quality densification |
PPF Case Study: Quality of Outcomes |
|
2 |
Direct |
|
Proximity to facilities, shops, etc |
SIMD: Average drive time to a post office in minutes; Average drive time to a retail centre in minutes; Public transport travel time to a post office in minutes; Public transport travel time to a retail centre in minutes – PTAL Scores |
CSO - 'Measuring Distance to Everyday Services in Ireland'; EPA and NTA may have tools for measuring walkability. PTAL under development. |
2 |
Moderate |
|
Tourism projects developed (+visits_ |
ECON6: Investment in Economic Development and Tourism per 1,000 population |
Failte Ireland Key Tourism Facts |
2 |
Direct |
|
Amenities in use - libraries, leisure centres, community centres |
C&L5a: Percentage of adults satisfied with libraries; C&L5c: Percentage of adults satisfied with museums and galleries; C&L5d: Percentage of adults satisfied with leisure facilities |
'NOAC or 'Libraries Development' - Committee of LGMA monitors library service indicators; |
2 |
Indirect |
|
Enforcement activity |
Complaints lodged and investigated; Breaches identified – no further action taken; Cases closed; Notices served |
Local authority Annual Report |
1 |
Direct |
Environment – Conservation and Improvement
|
Indicators - range from survey |
Data Source - Scotland |
Data Source – Ireland |
Level |
Relationship to planning |
|
SEA Monitoring |
|
Second Review of SEA Effectiveness in Ireland (EPA, 2018) |
|
Direct |
|
No. trees planted |
|
Annual Forest Statistics Ireland (DAFM, 2019) |
|
Direct |
|
Habitat + watercourse improvement |
SEPA: River Water Quality |
EPA's Water Quality Report |
2 |
Direct |
|
Access to open space |
SHS: Access to green and blue space |
Green Infrastructure Strategies (county level) |
2 |
Direct |
|
Environment indicator - air quality |
Scotland Air Quality Data |
EPA's Air quality report |
2 |
Moderate |
|
Recorded LBAP species |
Biodiversity Action Reporting: BAP Species; BAP Habitats |
Article 12 report 2015 (NPWS) |
2 |
Direct |
|
Protected land in good condition (heritage, special designations) |
SNH: Statutory Designated Areas |
Article 17 report 2019 (NPWS) |
2 |
Direct |
|
Protected buildings in good condition (heritage, special designations) |
HES: Listed buildings, Scheduled Monuments |
Record of Protected structures is complemented by an annual grants scheme and there has been an annual ‘structures at risk’ fund for the last number of years. https://www.chg.gov.ie/heritage/built-heritage/financial-assistance-for-architectural-heritage/ PA should also be able to advice on the number of declarations issue, the number of notices served under section 59 & 60. Number of additions/deletions to the RPS may also be an indicator, National Inventory of Architectural Heritage (no condition data) and National Monuments (no condition data); Enforcement Action cases re: protected structures |
2 |
Direct |
|
Capacity of SUDS |
|
|
|
Direct |
|
Water quality |
SEPA: River Water Quality; Coastal Bathing Water Quality |
EPA's yearly Water Quality Report and EPA's yearly Bathing Water Quality Report |
2 |
Direct |
|
Derelict land |
Vacant and Derelict Land Register |
Vacant site register held by each individual local authority; Derelict Sites Registered; No of dangerous buildings notices served. |
2 |
Direct |
|
Annual sustainability audit in local authorities |
|
|
|
|
|
% urban greening in projects |
|
Individual local authority green infrastructure strategies and/or open space strategy
|
|
Direct |
|
Parks and open spaces |
C&L5b: Percentage of adults satisfied with parks and open spaces |
|
2 |
Direct/Moderate |
|
Listed building refurbished |
Buildings at Risk Register |
|
2 |
Direct |
|
Listed building repurposed |
Buildings at Risk Register |
|
2 |
Direct |
|
Greenspace enhanced/preserved |
Planning Performance Statistics |
|
1 |
Direct |
|
Flood protection schemes completed |
Planning Performance Statistics |
OPW completed flood schemes |
1 |
Direct |
|
Renewables development/use |
Planning Performance Statistics |
Eirgrid Annual Renewable Energy Constraints and Curtailement Report; SEAI - BER rating maps/trends; planning register and/or ABP datasets for permitted projects within the renewable sector, including SID. Review against commencement notices |
1 |
Direct |
|
Waste management |
SHS: Waste Recycling behaviour; SEPA: Household Waste Generated |
EPA National Waste Statistics and Regional SDGs Ireland 2017: Topic 6.9 Household waste by county, 2016 |
2 |
Direct |
Homes and Communities
|
Indicators - range from survey |
Data Source - Scotland |
Data Source – Ireland |
Level |
Relationship to planning (direct, moderate, indirect) |
|
Quality of new/affordable homes |
PPF Case Study: Quality of Outcomes |
BER ratings |
2 |
Direct |
|
Compact growth |
PPF Case Study: Quality of Outcomes |
Project Ireland 2040: the First Year: Annual Report; Local authority Planning Application Data/Geodirectory - % growth within settlement boundaries (vis-à-vis NPF targets) One-off rural housing as a % |
2 |
Direct |
|
Housing quality |
HSN3: Percentage of council dwellings meeting Scottish Housing Standards; SIMD: Percentage of people in households that are overcrowded; Percentage of people in households without central heating |
Regional SDGs in Ireland - Private households by type of central heating by county, 2016; SEAI - BER rating maps/trends CSO data on floor area size trends for planning permissions (BHQ05) |
2 |
Direct |
|
Pre-application advice given and followed |
PPF Case Study: Quality of Service + Engagement |
no of planning permissions granted following 247 meetings and number of SHD granted following pre application consultation with ABP. |
1 |
Direct |
|
Change between permission and development |
PPF Case Study: Quality of Outcomes |
Enforcement Cases |
1 |
Direct |
|
Conversion rate from planning consent to built development |
PPF: Housing completions over the last 5 years |
Local authority Planning Application Data/BCMS ; CSO data and the commencement notices |
1 |
Direct |
|
Residential completions - by size and type |
PPF: Housing completions over the last 5 years |
Housing completions data collected by Local Authorities; CSO/DHPLG & BCMS |
1 |
Direct |
|
Affordable/social rent units completed |
PPF: Housing completions over the last 5 years |
Housing data collected by Local Authorities’ housing section |
1 |
Direct |
|
Carbon-neutral homes completed; Passive building standards |
HSN5: Percentage of council dwellings that are energy efficient |
CSO Regional SDGs 2017: Topic 4.4 Installation of energy saving products by private households in last 10 years; SEAI - BER rating maps/trends |
1 |
Direct |
|
Housing needs met |
Housing Needs and Demand Assessment; 5-year effective housing land supply programming |
HNDA Structural housing demand target Vs actual rate of housing completion (CSO) |
1 |
Direct |
|
Service access - water, waste, broadband |
SIMD: Percentage of premises without access to superfast broadband (at least 30Mb/s download speed) |
Regional SDGs in Ireland - Topic 7.5 - Private households with broadband access by county; DCCAE Broadband Access Mapping/Census Broadband Question |
2 |
Direct |
Economy and Town Centre
|
Indicators - range from survey |
Data Source - Scotland |
Data Source – Ireland |
Level |
Relationship to planning (direct, moderate, indirect) |
|
Balanced regional development |
Project Ireland 2040: Region by Region |
|
Direct/Moderate |
|
|
Impact of government projects |
ECON1: Percentage of unemployed people assisted into work from council operated / funded employability programmes |
Department of Social Protection: annual Statistical Information on Social Welfare Services report / Total Recipient numbers for schemes ; NDP/NPF Investment Tracker - Monitoring project coordinated by DPER |
2 |
Indirect |
|
Employment and investment numbers |
ECON6: Investment in Economic Development and Tourism per 1,000 population |
Failte Ireland: Regional Tourism Performance ; IDA/.Enterprise Ireland Supported Jobs NOAC- LEO supported jobs CSO census - POWSCAR/Workplace Zones |
2 |
Indirect |
|
Street/footfall |
Town Centre Health Check data |
Town Centre Health Check data extracted from retail strategy where available) |
1 |
Direct/Moderate |
|
Uplift measures - shorter time to let, increasing values |
ECON9: Town Vacancy Rates |
GeoDirectory: GeoView Commercial Vacancy Report (per Quarter) |
1 |
Direct/Moderate |
|
% edge of centre development |
Planning Applications |
|
|
Direct |
|
Service access - water, waste, broadband |
|
Project Ireland 2040: Region by Region
|
|
Direct |
|
£ capital investment |
Planning Applications |
|
|
Moderate |
|
SME growth |
ECON5: No of business gateway start-ups per 10,000 population |
CSO Business Demography 2017 and CSO Business in Ireland 2015 |
2 |
Indirect |
|
Employment land use |
PPF: Marketable employment land supply |
MyPlan - employment zoning (developed and undeveloped) |
2 |
Direct |
|
Office space completed |
PPF: Employment land take-up during reporting year |
Employment Land surveys by Local Authorities (where available, no unified coverage); Valuation Office - GIS data (if available); |
2 |
Direct |
|
Factories/warehouses completed |
Planning Performance Statistics |
Valuation Office - GIS data (if available) |
1 |
Direct |
|
Retail space completed |
Planning Performance Statistics |
Valuation Office - GIS data (if available) |
1 |
Direct |
|
Commercial leisure development completed |
Planning Performance Statistics |
Valuation Office - GIS data (if available) |
1 |
Direct |
|
Pre-application advice given and followed |
Percentage and number of applications subject to pre-application advice |
No. of planning permissions granted following 247 meeting |
1 |
Direct |
|
Change between permission and development |
PPF Case Study: Quality of Outcomes |
Comparison of compliance submission with planning drawings |
2 |
Direct |
|
Planning cost |
ECON2: Cost per planning application |
|
1 |
Direct |
|
Planning decision time |
Decision-making Timescales (Major, Local, Householder); Percentage and number of major applications subject to processing agreement; ECON3: Average time per business and industry planning application (weeks) |
An Bord Pleanála Planning Casework per Quarter
|
1 |
Direct |
|
Passive building standards; Carbon-neutral development |
Planning Applications |
|
|
Direct |
Movement
|
Indicators - range from survey |
Data Source - Scotland |
Data Source – Ireland |
Level |
Relationship to planning (direct, moderate, indirect) |
|
Public transport improved - no. of new routes/station/stop improvements |
Planning Applications |
Project Ireland 2040: Region by Region |
1 |
Direct |
|
Roads completed |
Planning Applications |
Project Ireland 2040: Region by Region |
1 |
Direct |
|
Railways completed |
Planning Applications |
Project Ireland 2040: Region by Region |
1 |
Direct |
|
Cycleways completed |
Planning Applications |
|
1 |
Direct |
|
Footpaths completed |
Planning Applications |
|
1 |
Direct |
|
% sustainable travel |
PTAL Statistics |
Regional SDGs in Ireland - Topic 5.11 Means of travel to work by region, 2016; Census Travel To Work - also Local studies - e.g canal cordon count NTA statistical bulletins - bus and rail/heavy rail etc. |
2 |
Direct |
|
Children walk/bike to school regularly |
|
CSO 2016 Census: Profile 6 Commuting in Ireland: Student Travel Patterns |
2 |
Moderate |
|
Access to sustainable transport |
SHS: Number of bikes available for private use by households: 2018; Adults (16+) - use of local bus services, and train services in the previous month: 2018; Main mode of travel, 2018 |
NTA - PTAL Scores |
2 |
Indirect |
|
Parking availability |
|
|
|
|
|
Average speed in area |
Traffic models |
|
|
Moderate |
|
Completeness of active travel network |
GIS data |
RSA - Free Speed Survey
|
|
Direct |
|
Walkability |
SHS: Adults (16+) - frequency of walking in previous 7 days: 2016 |
|
2 |
Direct/Moderate |
Health and Wellbeing
|
Indicators - range from survey |
Data Source - Scotland |
Data Source – Ireland |
Level |
Relationship to planning (direct, moderate, indirect) |
|
Mental health |
SIMD: Proportion of population being prescribed drugs for anxiety, depression or psychosis |
CSO Irish Health Survey 2015 |
2 |
Indirect |
|
Physical health |
SIMD: Comparative Illness Factor: standardised ratio |
Regional SDGs in Ireland - Topic 2.11 - Perception of health status by region Census question on 'How is your health in general?' |
2 |
Indirect |
|
Healthcare facilities |
SIMD: Average drive time to a GP surgery in minutes; Public transport travel time to a GP surgery in minutes |
CSO - Measuring Distance to Everyday Services in Ireland HSE, National Patient Experience Survey (NTES) HSE / HSE Service Map |
2 |
Moderate |
|
Community facilities |
SIMD: Access to facilities |
|
|
Moderate |
|
Educational attainment |
CHN11: Percentage of pupils entering positive destinations |
Regional SDGs in Ireland - Topic 3.1 to 3.7 |
2 |
Indirect |
|
Open space volume (increasing/decreasing) |
Planning Applications, Vacant and Derelict Land Register |
Individual local authority green infrastructure strategies and/or open space strategy |
|
Direct |
|
Complaints to council post-development |
Enforcement complaints, no. |
Number of enforcement complaints |
|
Direct |
|
Wellbeing impact |
National Performance Framework: Wellbeing Report |
HSE Health Ireland Survey |
2 |
Indirect |
|
Local food production + access |
|
|
|
|
|
Digital access |
SIMD: Percentage of premises without access to superfast broadband (at least 30Mb/s download speed) |
|
1 |
Moderate |
Engagement and Service
|
Indicators - range from survey |
Data Source - Scotland |
Data Source – Ireland |
Level |
Relationship to planning (direct, moderate, indirect) |
|
Conversion rate from planning consent to built development |
Building Standards data - UNIFORM |
number of commencement notices submitted |
1 |
Direct |
|
Time take to start/complete development. |
Planning application data |
Planning permission/commencement time-lag |
|
Direct |
|
CIL/S.106/Developer contributions capture |
Developer contributions: clear expectations - set out in development plan (and/or emerging plan,) and - in pre-application discussions |
Number of appeals against contributions |
1 |
Direct |
|
Pre-application advice given and followed |
Percentage and number of applications subject to pre-application advice |
Number of planning permissions granted followed by 247 meetings |
1 |
Direct |
|
Change between permission and development |
PPF Case Study: Quality of Outcomes |
Enforcement notice subsequent to commencement |
2 |
Direct |
|
Role of elected members |
PPF Case Study: Elected members engaged early (pre-MIR) in development plan preparation - evidence to PPF |
|
1 |
Direct |
|
Consistency of decision making |
Production of regular and proportionate policy advice, for example through supplementary guidance, on information required to support applications |
number of planning authority decisions overturned by An Bord Pleanála |
1 |
Direct |
|
Assessment against policy (e.g. designing streets, making better places) |
PPF Case Study: Quality of Outcomes |
|
2 |
Direct |
|
Use of CIL/S106 |
|
no equivalent in ROI |
|
Direct |
|
Transparency of plan |
National Headline Indicator: Development plan scheme demonstrates next Local Development Plan: on course for adoption within 5-year cycle; project planned and expected to be delivered to planned timescale |
|
1 |
Direct |
|
Participation in plan-making |
PPF Case Study: Quality of Service and Engagement - Local Development Plan Consultation, Register of Interest |
number of submissions recorded at issues paper, draft plan, material amendments stages |
1 |
Direct |
Appendix C: Developing the toolkit – a worked example
A local plan was selected by the team to trial the draft toolkit with a worked example. Figure 14 and 15 show the toolkit being populated with data from the local plan and data from monitoring reports. Future data and monitoring opportunities were identified by the local authority. The scoring was conducted by the team, which has provided an aggregate score for the below visualisation. It should be noted that the Worked Example was carried out on the draft toolkit framework.
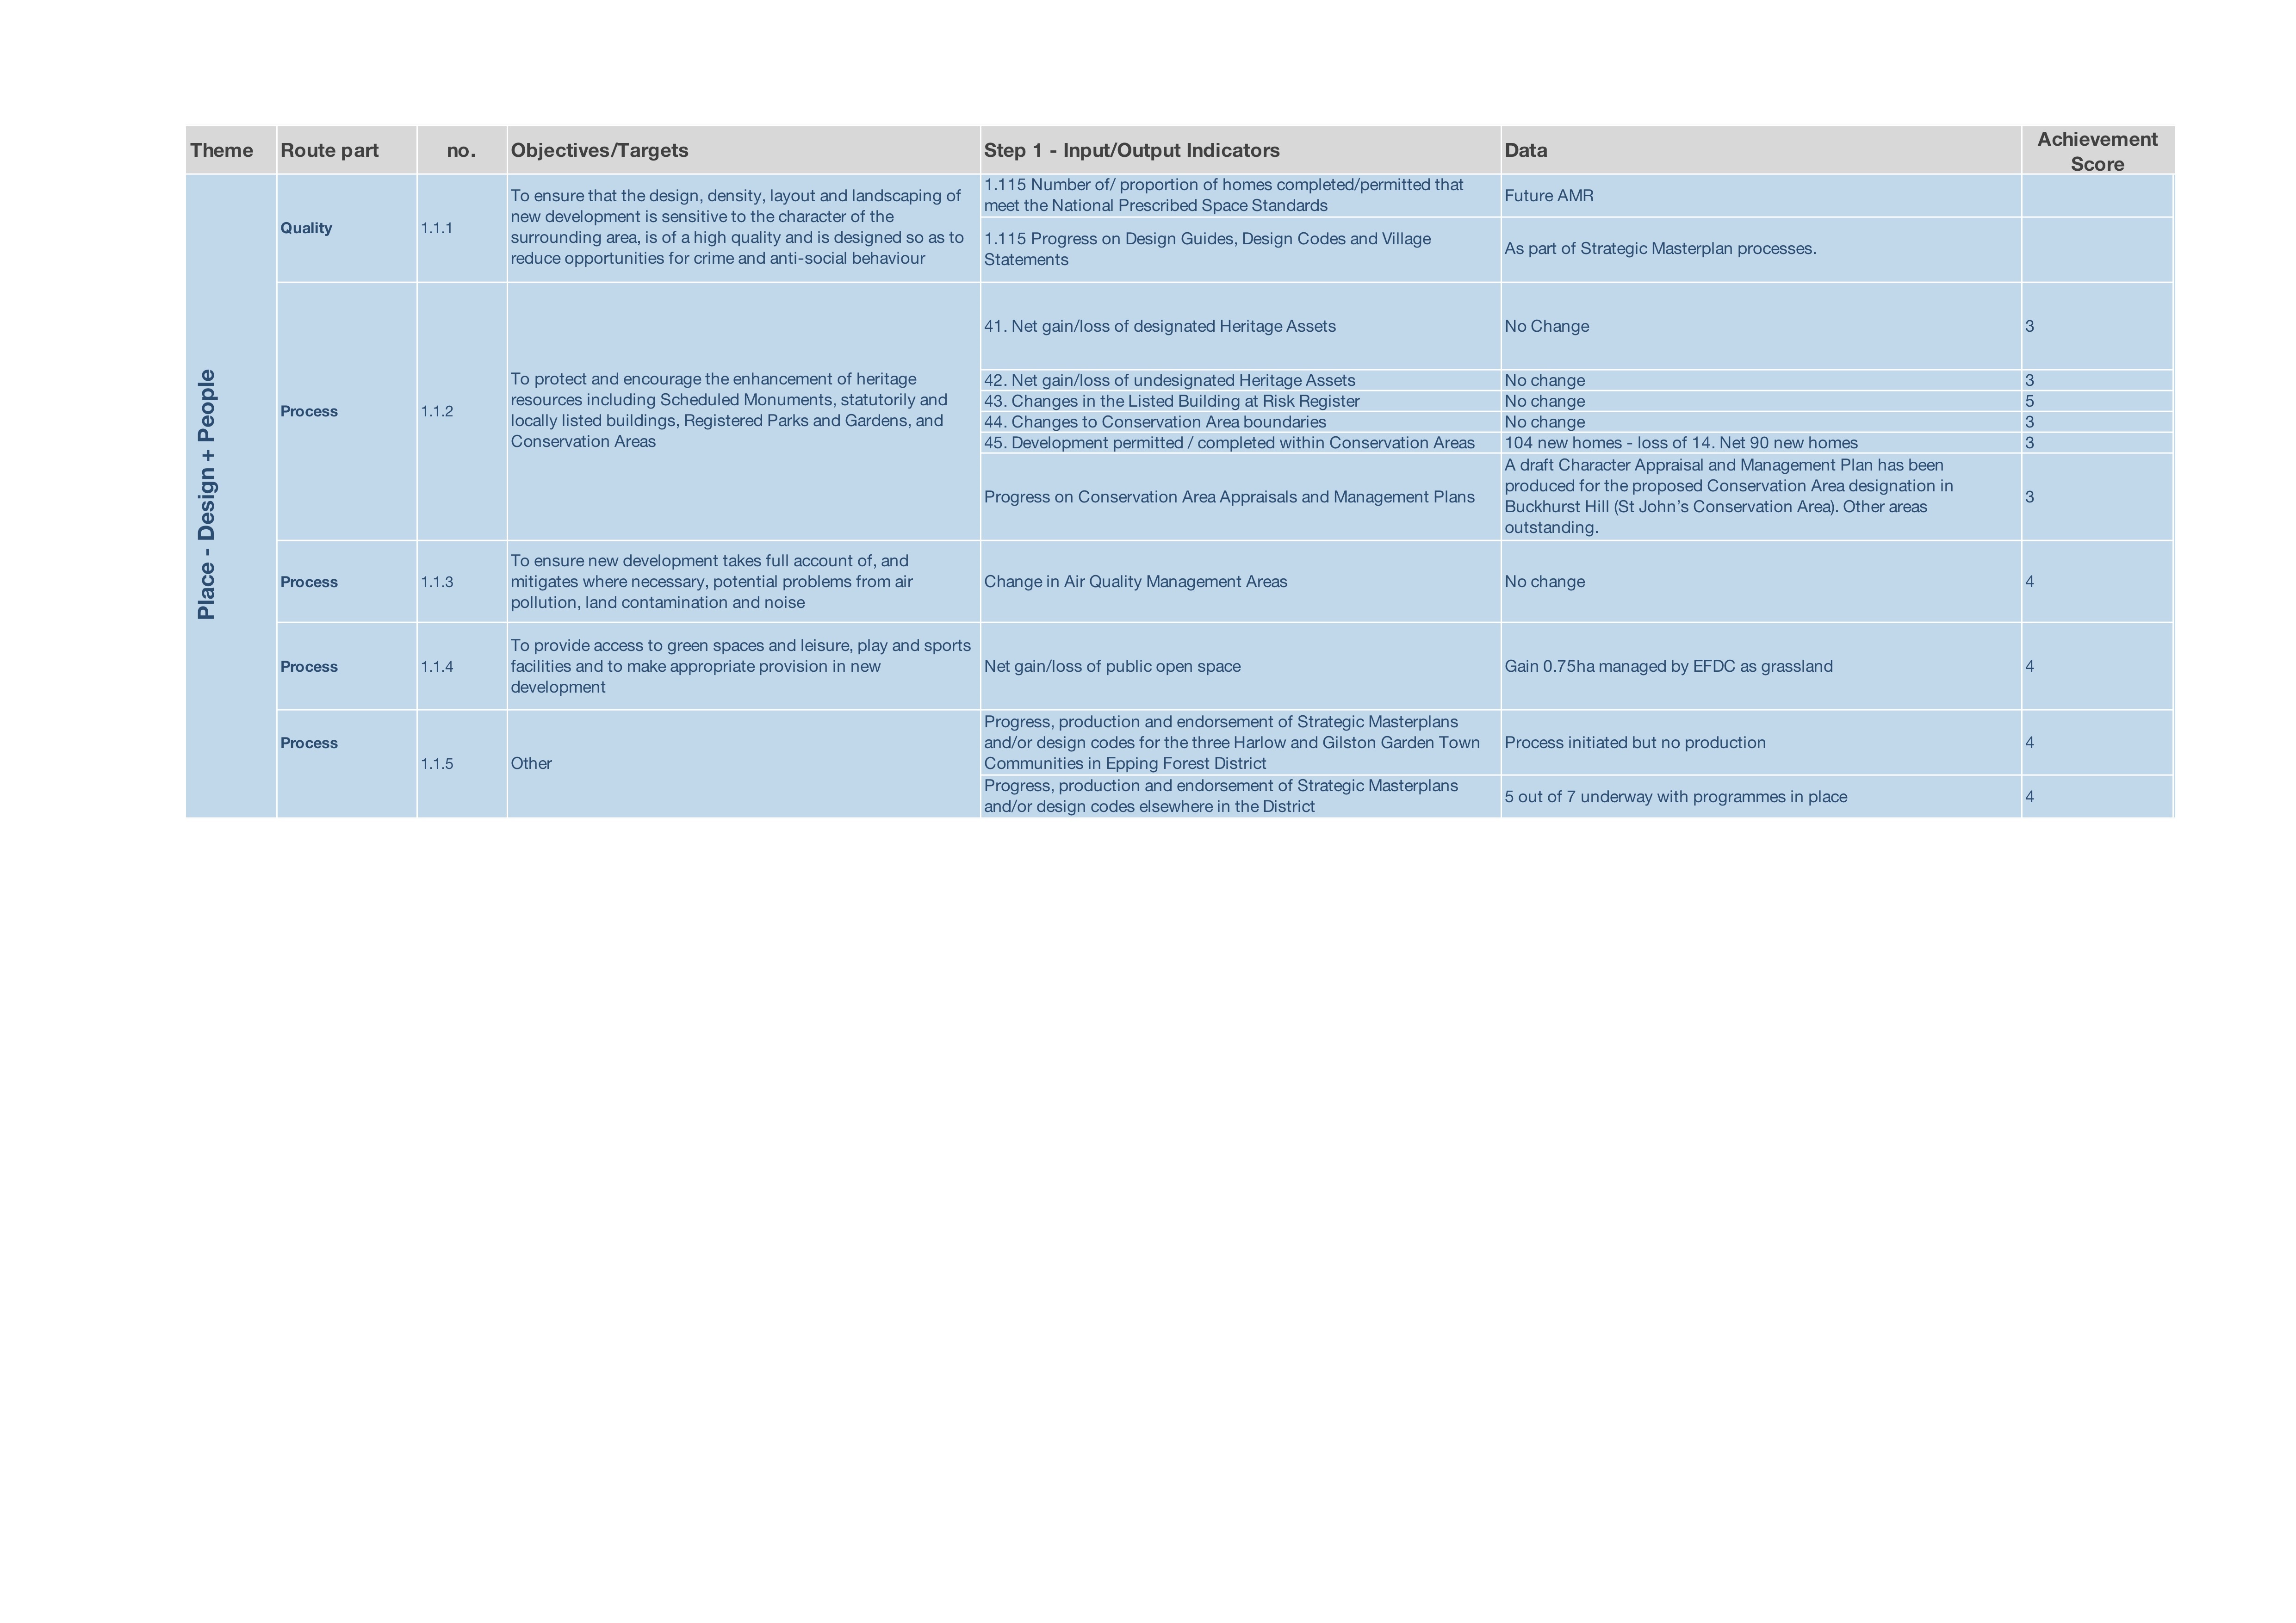
Figure 14 Table showing an analysis section of the toolkit
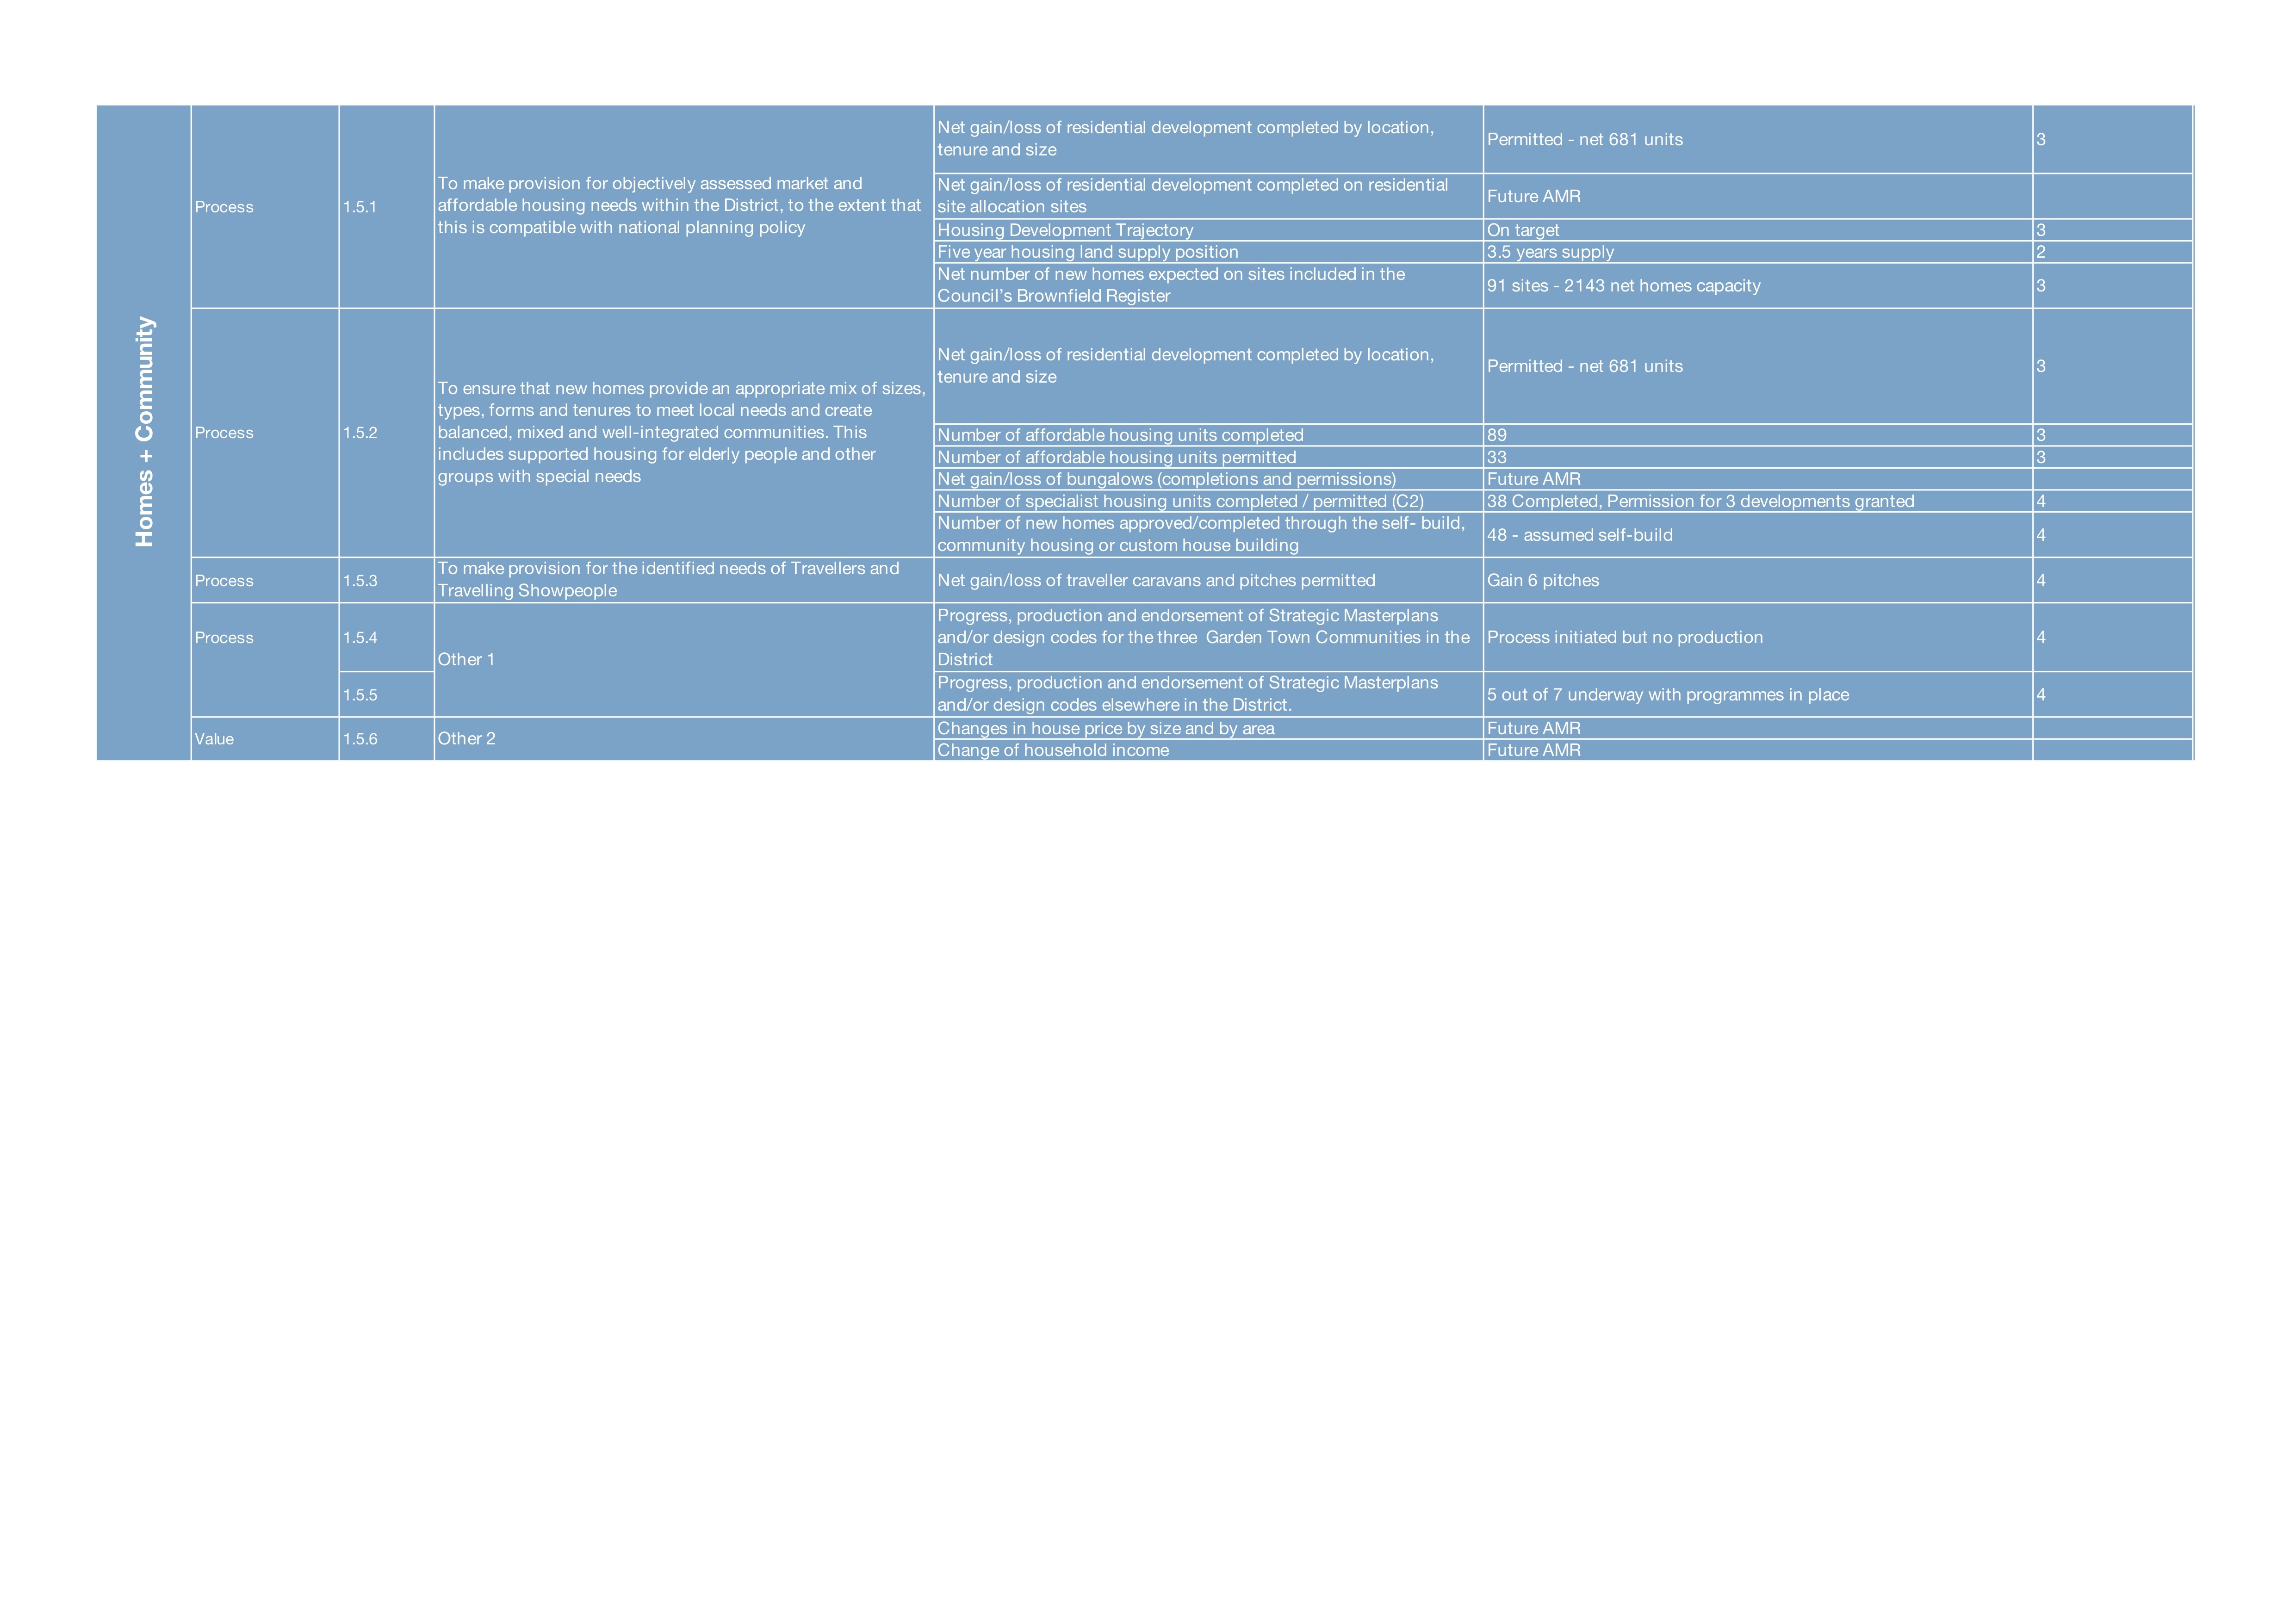
Figure 15 Table showing an analysis section of the toolkit

Figure 16 An example of scoring
|
For more information about this paper www.rtpi.org.uk RTPI - Royal Town Planning Institute Tel: 020 7929 9494
Report authors: Kevin Murray Associates University of Dundee McCabe Durney Barnes Cardiff University yellow book |
[1] KMA, yellow book, McCabe Durney Barnes, University of Dundee and Cardiff University.
[2] Scottish Government, Architecture and Design Scotland, NHS Health Scotland. Place Standard: How Good is Our Place? https://www.placestandard.scot
[3] The work was commissioned and funded by RTPI along with the Scottish Government, the Irish Office of the Planning Regulator (OPR), the Department of Housing, Local Government and Heritage (DHLGH) in Ireland, the Welsh Government and the Ministry for Housing Communities and Local Government (MHCLG) in England.
[4] AlWaer, H., & Illsley, B. (Eds.). (2017). Rethinking Masterplanning: Creating Quality Places. ICE Publishing.
[5] Trained, P. (2011). The Bishop Review: The Future of Design in the Built Environment.Project Report. London: CABE.
[6] United Nation, UN Sustainable Development Goals Icons, https://www.un.org/sustainabledevelopment/news/communications-material/
[7] RTPI, D. Adams et al. Delivering the Value of Planning. August 2016.
[8] RTPI, Vivid Economics. Invest and Prosper. October 2020.
[9] Planning Advisory Service. Monitoring that matters - towards a better AMR. April 2011.
[10] Department for Infrastructure. Northern Ireland Planning Monitoring Framework. 2018-2019.
[11] OPR (2019) Strategy Statement 2019-2024.
[12] RTPI. (2001) New Vision for Planning.
[13] Scottish Government, yellow book, Nick Wright Planning. (2018) Monitoring the outcomes of planning: a research study
[14] Wong et al. (2007) Outcome Indicators for Spatial Planning in England – Framework Report. University of Manchester, Centre for Urban Policy Studies. P34
[15] Urban Analytics and City Science, Shahab, Clinch and O’Neill. (2019) Impact-based Planning Evaluation: Advancing Normative Criteria for Policy Analysis
[16] Cook, A. (2017) Outcomes-Based Approaches in Public Service Reform, What Works Scotland Position Paper
[17] Communities Scotland. (2007) Delivering Change: Understanding the outcomes of community learning and development
[18] Government of Ireland. (2015) Planning Policy Statement, https://housing.gov.ie P.8
[19] Government of Ireland. (2018) Project Ireland 2040: National Planning Framework.
[20] AlWaer, H. Bickerton, R. Kirk, D. (2014) Examining the components required for assessing the sustainability of communities in the UK. Journal of Architecture and Planning Research.
[21] ‘Le référentiel ‘Un aménagement durable pour la ville de Paris’ - Tool for evaluating the sustainability of urban places in Paris.
[22] Scottish Government, yellow book, Nick Wright Planning. (2018) Monitoring the outcomes of planning: a research study.
[23] Scottish Government, NHS Scotland, Architecture and Design Scotland. Place Standard Tool, Strategic Plan 2020 – 2030. P 11
[24] Government of Ireland. Project Ireland 2040 National Planning Framework, P. 13
[25] Government of Ireland. Project Ireland 2040 National Planning Framework, P. 12
[26] Scottish Government. National Performance Framework. https://nationalperformance.gov.scot/what-it
[27] Scottish Government, COSLA. (2019) Place Principle. It was developed by partners in the public and private sectors, the third sector and communities to help them develop a clear vision of their place. The Place Principle supports the National Performance Framework’s collective purpose for Scotland
[28] Scottish Government. Planning and Architecture National Planning Framework 4, https:/blogs.gov.scot/planning-architecture/2019/10/08/national-planning-framework-4-the-essentials/
[29] Welsh Government. (2019) Well-being of Wales 2018-2019. https://gov.wales/sites/default/files/statistics-and-research/2019-09/well-being-of-wales-2019-590.pdf
[30] Wales Audit Office. The Effectiveness of Local Planning Authorities in Wales. June 2019. P.8
[31] Department of Agriculture, Environment and Rural Affairs. (2018). United Nations Sustainable Development Goals mapped to Programme for Government Outcomes and Indicators: https://www.daera-ni.gov.uk/publications/united-nations-sustainable-development-goals-mapped-programme-government-outcomes-and-indicators
[32] UK Government. (2019) Implementing the Sustainable Development Goals: https://www.gov.uk/government/publications/implementing-the-sustainable-development-goals/implementing-the-sustainable-development-goals--2
[33] Place Alliance. (2019) Place Value & the Ladder of Place Quality. It contains a useful summary of the evidence
[34] RPTI. (2020) Invest and Prosper: A business case for investing in planning. This references the challenge of attribution and considers how planning is performing in wider policy areas
[35] RIAI. Creating Places for People: RIAI Town and Village Toolkit. May 2019
[36] Design Council for Wales. (2017) Places for Life
[37] Pearce, J. Robinson, R. (2000) Strategic Management: Formulation, implementation and control
[38] Pearce, D. Barbier, E. (2000) Blueprint for a sustainable economy
[39] Alwaer, H., Bickerton, R., & Kirk, D. (2014) Examining the Components Required for Assessing the Sustainability of Communities in the UK Journal of Architectural and Planning Research, 31(1), 1-26
[40] Egan Review: Skills for Sustainable Communities. (2004) https://www.ihbc.org.uk/recent_papers/docs/Egan%20Review%20Skills%20for%20sustainable%20Communities.pdf
[41] Kevin Murray was a part of this Task Force
[42] Al Waer, H. Kitson, M. & Croome, D. (2009) SuBETooL ( Sustainable Urban Built Environment Tool), framework and protocol for assessing sustainability. Developed with Hilson Moran and Reading University and put into practice by Hilson Moran in 2009. P100. This proprietary framework has been published internally by Hilson Moran, Husam Al Waer and Derek Croome (2009-present). This framework is available upon request
[43] RIBA Sustainable Outcomes Guide: https://www.architecture.com/knowledge-and-resources/resources-landing-page/sustainable-outcomes-guide
[44] Métropole du Paris. (2008) ‘Le référentiel ‘Un aménagement durable pour la ville de Paris’
[45] Inputs refer to the human, financial (including fees from planning income) and other resources deployed by planning policymakers and Planning Authorities. The other resources may include legal powers, statutory plans, planning policies and published guidance. The inputs are deployed to deliver planning activities
[46] In Ireland, The Department of Housing, Local Government and Heritage, in conjunction with the Regional Assemblies and the Office of the Planning Regulator has indicated an intention to review the current provisions for the monitoring and evaluation of plans with a view to strengthening the process and standardising the approach across Local Authorities


