 About this paper
The RTPI’s Corporate Strategy 2020-2030 identified a need to demonstrate, in economic terms, the positive contribution that planning makes across the UK. This report, commissioned from Vivid Economics, makes this case.
Click here to download a PDF of the report, or read it below.
Contents
- Introduction
- Planning system performance and constraints
- The value of planning outcomes to the UK
- Opportunities for raising ambition
Acronyms
|
ATI |
Active Transport Infrastructure |
|
BEIS |
Department for Business, Energy and Industrial Strategy |
|
BREEAM |
Building Research Establishment Environmental Assessment Method |
|
Defra |
Department for Environment, Food and Rural Affairs |
|
EIA |
Environmental Impact Assessment |
|
EV |
Electric Vehicles |
|
GDP |
Gross Domestic Product |
|
GHG |
Greenhouse Gases |
|
GVA |
Gross Value Added |
|
IAMP |
International Advanced Manufacturing Park |
|
KPI |
Key Performance Indicator |
|
LPA |
Local Planning Authority |
|
LSOA |
Lower-level Super Output Area |
|
MHCLG |
Ministry of Housing, Communities and Local Government |
|
NAO |
National Audit Office |
|
NDO |
Neighbourhood Development Order |
|
NHS |
National Health Service |
|
NPPF |
National Planning Policy Framework |
|
ONS |
Office for National Statistics |
|
PM |
Particulate Matter |
|
PDR |
Permitted Development Rights |
|
PPW |
Policy Planning Wales |
|
RTPI |
Royal Town Planning Institute |
|
SME |
Small to Medium-sized Enterprise |
|
SPP |
Scottish Planning Policy |
|
SPPS |
Strategic Planning Policy Statement for Northern Ireland |
|
UK |
United Kingdom |
|
UNESCO |
United Nations Educational, Scientific and Cultural Organization |
|
WHO |
World Health Organization |
Executive Summary
The planning systems in the UK set the context for development and create the enabling conditions for a sustainable and healthy built environment. Planning shapes the environments where people work, live and interact. Through strategic spatial planning, the system can ensure that all residents and businesses have a good level of access to services and infrastructure, resources are appropriately accounted for in development decisions, and that new developments make efficient use of resources and technologies. Planning can also address potential negative impacts of development which can be harmful to human health.
Analysis and research for this report finds that the planning systems across the UK underpin economic, social, environmental and health outcomes. Quality plan-making, and housing delivery in particular, is integral to meeting sustainable development targets. Key benefits the planning system directly provides or supports include:
- Affordable housing delivered through planning obligations saved the NHS[1] £240 million in 2019;
- Living in a well-planned neighbourhood can support up to 59% of NHS-recommended weekly activity;
- Urban greenspaces in Great Britain provide £16.5 billion in environmental, health and amenity value per year;
- Planning ensures good access to economic opportunities, with 73% of planning housing permissions in England located within 10km of a major employment cluster;
- Homes developed through planning permission are three times more likely to meet National Space Standards; and,
- Planning policies prevent excess air pollution, which costs the UK £9-19 billion each year.
Planning plays a key role in delivering these benefits, but they are poorly understood and seldom attributed to the planning system. Without effective planning systems, many of these benefits would not be captured, affecting the quality of life for residents and imposing costs on both the public and private sectors.
Current planning system challenges
Despite clear links between the planning system and the UK’s sustainable development ambitions, planning services are under increasing pressure and scrutiny. Constraints on planning system functions limit public planners’ capacity to deliver on strategic local priorities.
- Local Planning Authorities (LPAs) are under pressure to deliver more services with fewer resources. Total expenditure on planning policy has fallen by 22% in England since 2010, by more than 40% in Scotland since 2009, and by 50% in Wales since 2008-09.
- Planning is primarily measured against speed and quantity targets, rather than on the quality of development outcomes. The planning systems are typically judged against their ability to manage applications and grant development permissions quickly. Limiting planning to housing supply and delivery metrics can create a perception that the system is broken, and fails to measure the contribution of planning in enabling quality development outcomes.
- There is currently an imbalance in how planning is funded and the planning functions which deliver benefits. The majority of planning expenditure is on development management, and plan-making activities are unable to generate revenue. When plan-making is under-resourced, the framework for making development decisions may not reflect strategic priorities.
- There is unequal access to good planning services and their benefits. Inequities in LPA resources can deepen regional inequalities. Currently, planning services primarily serve the most well-off areas, despite the fact that planning supports health and housing for all. Local authorities in areas with poor health and social outcomes are also harder hit by budget cuts to planning.
Enabling UK development ambitions
Overcoming these challenges and prioritising the planning system can support planners to deliver on more ambitious development and recovery targets. Good planning can enable these ambitions, while places that are not strategically planned may lack resources, infrastructure and economic opportunities. Analysis for this report finds that raising ambition and building capacity in the planning system has the potential to deliver significant economic benefits across key UK and national priorities.
Without the planning system, the UK is unlikely to meet national affordable housing targets. The Governments of Scotland, Wales and Northern Ireland have all adopted ambitious affordable housing targets, while recent research in England suggests that 145,000 new affordable homes will need to be build each year to meet affordable housing needs. To achieve ambitious national targets, planners will need to identify where affordable housing is needed, enforce quality standards, ensure new homes have good access to amenities, support community cohesion, and coordinate developer contributions.
Planning systems can play a key role in encouraging active travel in the UK through identifying new opportunities and facilitating infrastructure investment. Active travel is currently impeded by a lack of safe and accessible infrastructure. In England, 52% of all trips under 5 miles are travelled by car, largely due to road safety concerns. Providing active travel infrastructure requires community engagement to identify where active travel is most needed, spatial planning, funding for infrastructure and stakeholder coordination.
Urban planning can maximise the potential health benefits of greenspace through strategic placement which prioritises improving access for new and/or existing residents. Poorly planned greenspaces are a missed opportunity to support broader public health priorities. A poorly planned greenspace is likely to deliver considerably less benefits for human health than a well-planned greenspace. Analysis for this report finds that a well-planned greenspace in a deprived neighbourhood delivers 500% more value than a poorly planned greenspace.
Planning systems can prevent locking-in inefficient, high-carbon infrastructure that will be used for decades. Through stringent climate requirements, the planning system has the potential to avoid significant carbon lock-ins from fossil-fuelled infrastructure that make it difficult to shift to lower-carbon pathways. This may be critical to supporting the net-zero transition.
Recommendations
This report identifies three opportunities for increasing the impacts of the planning system:
- Invest in planning as an essential public service. Like any good public service, the planning system requires resources and capacity to deliver outcomes efficiently, effectively, and equitably. Financial support to increase the number of public sector planners employed, funding for specialist knowledge and investing in efficiency-saving digital technologies can help support the shift from a largely reactive, regulatory planning system, to a proactive and strategic planning system.
- Support capacity-building in public sector planning. Strategic plan-making requires technical skills and a deep understanding of community needs and priorities. Prioritising strategic planning includes non-financial actions, such as freeing up resources by reducing needlessly burdensome regulations and changing performance targets to measure quality instead of speed or efficiency.
- Provide new models of funding for plan-making. Most planning expenditure is on development management, with the greatest spending cuts in recent years seen in planning policy. This is partly due to increasing statutory obligations on development management, and partly due to the functions of planning which generate revenue. Funding available for non-revenue generating plan-making activities, such as the Planning Delivery Fund, could be greatly expanded in size and scope to incentivise quality outcomes, joint working, community participation, the digitisation of part of the planning process, and climate ambitions.
1. Introduction
Local authorities in the UK are under increasing pressure to deliver more services with fewer resources. Local authorities in England and Scotland saw 27% and 11% respective reductions in funding between 2010 and 2016, with spending on non-statutory services declining up to 45%. These budget cuts place local authorities under intense pressure and make key health, social and economic services unaffordable. Moreover, these cuts are exacerbating inequalities, with the most deprived areas facing the biggest cuts. Across the UK, the most deprived areas faced higher budget cuts per person than the most affluent areas, while simultaneously facing higher expenditures on social care services [2].
Planning services are under particular pressure and scrutiny. Total expenditure on planning policy has fallen by 22% in England since 2010, by more than 40% in Scotland since 2009, and by 50% in Wales since 2008-09 [3]. These budget constraints have forced Local Planning Authorities (LPAs) to prioritise meeting statutory obligations around development management over plan-making. Compounding these budget cuts, planning authorities are under pressure to quickly address applications and deliver housing targets. The system is sometimes perceived as an impediment rather than an enabler of housing development due to the uncertainty and complexity of the current development management process [4]. Some argue that the planning system artificially raises the costs of housing and limits economic growth by constraining development [5].
Despite resource constraints, population growth and mobility are creating an urgent need for good planning in both urban and non-urban areas. Currently, 83% of the UK population lives in a predominantly urban area, with the fastest growing populations in central London [6]. Simultaneously, the UK has a rising trend of urban-to-rural outmigration, creating a need for amenities, services and housing in towns outside of major metropolitan areas [7]. High-quality planning is needed to efficiently meet the needs of people in all areas.
There is increasing recognition that the planning system and the UK’s sustainable development ambitions are intrinsically linked. Planning sets the context for the built environment, shaping the way people live, work and interact. Good planning can support the UK’s ambitious economic, housing, health and environmental objectives; on the other hand, places that are not strategically planned may lack resources, infrastructure and economic opportunities. The UK Government’s recent Planning White Paper recognises that the current system constrains planners and inhibits high-quality development [8][9].
Planners have been at the centre of the UK’s COVID-19 initial emergency response and recovery. Many local authorities have designated planners as ‘critical workers’ during the pandemic as they oversaw immediate coordination functions. As authorities have moved their attention to recovery, the role of planners has become increasingly prominent. This has included oversight of initial spending of the UK Government’s emergency active travel fund and longer-term activities focused on ‘building back better’. The pandemic has increased both the public and the media’s attention to community issues such as the equitable provision of greenspace, gardens and quality places and homes. Planning will be central to the delivery of improved place-making outcomes increasingly desired by the public and the wider professional community [10].
The aim of this report is to build a case for investing in the capacity of the planning system by providing clarity on the links between the planning system and economic value, and offering a vision for investing in planning as a critical public resource.
Methodology
This report draws on a combination of desk-based review, stakeholder engagement and original analysis to build a business case for investment in the UK planning systems.
- A review of Royal Town Planning Institute (RTPI) research and consultations, academic literature, grey literature, government publications, government white papers, and nationally published statistics;
- Interviews with RTPI stakeholders, public and private sector planners; and
- Primary analysis of the value of planning outcomes based on public datasets and academic literature (see Appendix for a description of the methodology, data used and sources of assumptions).
Structure of report
The rest of the report is structured as follows:
- The first section provides context on the structure and objectives of the planning systems in the UK and the ways in which it is currently limited;
- The next section details how good planning can drive ambitious development outcomes and the value associated with a high-quality built environment; and,
- The final section concludes with a vision for a well-resourced and ambitious planning system.
2. Planning system performance and constraints
Planning systems across the UK
The planning systems in the UK set the context for development and create the enabling conditions for sustainable, high-quality, and well-designed places.
Planning in the UK consists of four national systems with common features and key differences. All four nations in the UK have a planning system that is ‘plan-led’. This requires that national and local planning policy is set out in formal development plans which outline planning permission criteria and aim to balance development needs and environmental protection in the public interest. Decisions on individual planning applications are then made on the basis of these plans [11].
All four systems enable quality development through two core functions: plan-making and development management:
- Plan-making identifies local strategic priorities for development and supports placemaking. Local development plans[12] set out both an ambitious vision for future development and identifying and addressing an area’s needs for housing, employment, and infrastructure. Plan-making provides an opportunity for stakeholders to bring different perspectives to the planning process, and for communities to be involved in designing the future of places. National planning policies (described below) provide guidance for plan-making to deliver well-designed, high-quality places for communities to live and work.
- Development management is a proactive process to align development with local development plans and meet quality standards. All new development goes through a process of planning permission where Local Planning Authorities (LPAs) ensure that development meets statutory criteria for quality and aligns with local strategies. This process also allows for LPAs to negotiate contributions from developers to support community needs or to mitigate concerns the LPA may have about the introduction of a new development in the area [13]. This typically involves compensation for potential negative impacts of development (such as increased pressure on resources and pollution), provision of affordable housing and a contribution to meet wider infrastructure needs [14].
|
Box 1: Key differences across the UK planning systems Although the four national planning systems have similar objectives, structure and functions, there are key differences in priorities and practical operations. All four systems allow developers to make changes to a building, or land, without the need to apply for planning permission under certain criteria [15]. These rights are often called Permitted Development Rights (PDR). However, while certain categories of development are automatically deemed to have planning permission in all four nations, there are notable differences in the scope of permitted development. In Scotland and Northern Ireland, permitted developments typically include small extensions or alterations to buildings. In England and Wales, however, developers have far greater flexibility including being allowed to convert an entire building from being an office into residential use without needing planning permission [16]. Planning contribution agreement processes also differ by nation. In all four nations, planning contributions can be used to meet any concerns that authorities may have about the new infrastructure, including additional pressure on resources and affordable housing needs. These contributions are negotiated through varied processes by nation:
In England and Wales, in addition to s106 obligations, developers may also be required to contribute towards local infrastructure through the Community Infrastructure Levy (CIL). The CIL is set locally and is a fixed charge which can be levied on specific types of development but is often focused on housing and employment schemes. The levy can be used to fund a wide range of infrastructure needs, including transport, schools, hospitals, and other health and social care facilities; however, charging authorities may not use the levy to fund affordable housing [20]. There is no requirement for a local authority to charge the CIL and its use is currently still limited: in 2019, only 47% of LPAs in England charged the levy [21]. |
Policy frameworks across all four nations set high ambitions for planning to deliver sustainable development, well-designed places, economically viable towns and enabling a sufficient supply of quality homes.
- The National Planning Policy Framework (NPPF) is the foundation of all planning in England [22]. The Framework provides guidance on the preparation of local development plans and sets objectives for social, economic, and environmental considerations. Critically, the NPPF sets the ‘presumption in favour of sustainable development’ for both plan-making and development management. This means that all adverse impacts of development should be demonstrably outweighed by the benefits of the proposal and that key resources should be safeguarded.
- Policy Planning Wales (PPW) promotes a planning process in the nation which maximises the contribution of development to the wellbeing of Welsh communities [23]. The primary purpose of PPW is to ensure that the planning system contributes towards the delivery of sustainable development and improves the economic, environmental, social, and cultural well-being of the country. Additionally, The National Development Framework (NDF) is a new development plan that will set the direction for development from 2020 to 2040 [24]. It establishes a strategy for addressing national priorities through the planning system, including sustaining a resilient economy, accelerating decarbonisation, and improving the well-being of local communities.
- Scottish Planning Policy (SPP) sets out the national planning policies which reflect Scottish Ministers’ priorities for the development and use of land [25]. The SPP promotes consistency in the application of policy across Scotland whilst allowing sufficient flexibility to reflect local circumstances and, critically, requires development to be considered with the objective of contributing tosustainable Additionally, The National Planning Framework (NPF) is the spatial expression of the Government Economic Strategy, and of the national plans for development and investment in infrastructure [26]. Together, SPP and NPF guide the planning system to deliver the Government’s vision and outcomes for Scotland.
- The Strategic Planning Policy Statement for Northern Ireland (SPPS) reflects the expectations for delivery of the planning system [27]. Sustainable development is at the heart of the SPPS. It requires planning authorities to deliver on all three pillars of sustainable development in formulating policies and plans and in determining planning applications and appeals. These refer to the needs and aspirations of society, the economy, and the environment.
Key development challenges in the UK
Quality plan-making and housing delivery in particular is integral to meeting the UK’s ambitious sustainable development targets.
Well-planned and sustainable communities are at the core of the UK’s long-term industrial strategy [28]. The UK’s Industrial Strategy sets out five foundations of productivity, all of which rely on high-quality places which have a well-developed local economy, good access to jobs and sustainable infrastructure. The Industrial Strategies set out four grand challenges: artificial intelligence and data, an ageing society, clean growth and the future of mobility. All four of these challenges require a planning system with the resources and capacity to promote an ambitious UK development vision. Key targets which rely on planning include:
- £400 million in EV charging infrastructure;
- £1 billion of public investment in digital infrastructure;
- Improved productivity of SMEs;
- Building on local strengths and deliver on economic opportunities in local industrial strategies; and,
- Driving enhanced productivity through improved intra-city transport.
Sustainable housing is key to reaching the UK’s 2050 net zero target. The UK is one of the first countries in the world to set out a net zero greenhouse gas (GHG) emissions target by 2050 into legislation [29]. Low-carbon development will be an essential part of reaching this ambition, as residential and public sector accounted for 20% of total GHG emissions in the UK in 2018 [30]. The main source of emissions in this sector is the use of natural gas for heating and cooking, not inclusive of electricity consumed by households, further underscoring the need for energy-efficient and well-planned buildings. Transport emissions also account for 2.6% of emissions and increasing, driven by continual growth in vehicle travel. Emissions in this sector can be mediated by providing sufficient active travel infrastructure, public transportation, and efficiently planned places which minimize the need for vehicle travel.
The planning system supports delivering ambitious targets for suitable and affordable housing in the UK. The UK government has targeted the delivery of 300,000 new homes per year in England by the mid-2020s [31]. The Scottish and Welsh Governments have set ambitions to deliver at least 50,000 and 20,000 affordable homes by 2021 respectively, with 35,000 of the homes in Scotland designated to be social rent [32]. The Government in Northern Ireland has set a target of 1,850 social housing starts in 2019-20 [33]. Planning can support delivery of affordable housing, which may not be delivered through the private sector, even where total supply issues are remedied.
High quality homes, safe living environments and access to opportunities for exercise and recreation enable population health. The devolved national public health agencies all prioritise environmental and social conditions which affect public health. Key planning-related priorities in the Public Health England 2020-2025 strategy, and the Public Health Wales 2018-2030 strategy, include creating cleaner air, improving mental health conditions and reducing childhood health inequities[34]. Well-planned places, particularly those with access to green infrastructure and that enable community cohesion, are important for supporting the mental and physical health of residents. Access to greenspace is particularly important for childhood development; having high access to greenspace in childhood can reduce risk of developing mental health diseases later in life by up to 55% [35].
Performance and constraints
While ambitions set at the national levels to deliver on quality through planning are high, the capacity of the planning system at local levels is constrained by limited resources and misaligned incentive structures. These constraints on planning system functions have led to the prioritisation of statutory development management and left limited resources for driving quality outcomes through plan-making.
Limited resources
Budget cuts have forced Local Planning Authorities to prioritise expenditure on meeting statutory obligations around development management over plan-making. Total expenditure on planning policies has fallen by 22% in England since 2010 (Figure 1), by more than 40% in Scotland since 2009, and by 50% in Wales since 2008-09 [36]. As a result, planning authorities have prioritised funding statutory obligations, with more than two-thirds of planning expenditure in England on development management activities. This has also led to reductions in capacity and local expertise on social and environmental considerations; for example, in 2013, less than one-third of LPAs had in-house ecological experts [37].
Figure 1: Planning expenditure has fallen by 22% since 2010
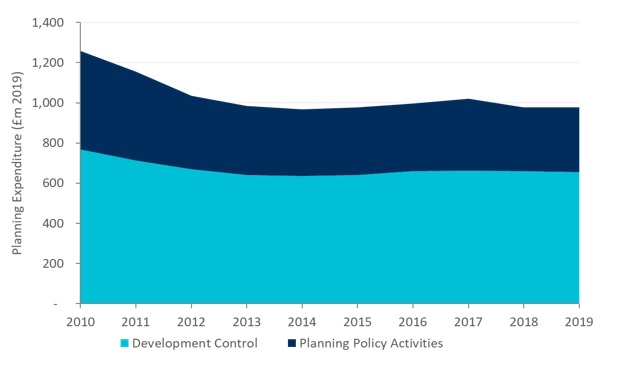
Source: Vivid Economics and ONS local authority expenditure in England
Lack of resources within the public sector for planning has led to a shift from public to private sector planners, risking building institutional capacity needed to deliver local priorities. Public and private sector planners offer complementary skills, knowledge and perspectives to deliver high-quality development. Private sector planners can offer perspectives on commercial viability and draw on knowledge from a geographically diverse portfolio of work. Public sector planners bring the perspective of a deep understanding of local community needs and can deliver effective stakeholder coordination. The share of town planners employed by the private sector in the UK increased from 29% in 2005 to 46% in 2018, with the shifts in private sector employment beginning around the time of severe public planning budget cuts in 2010 [38]. The shift from public to private risks inhibiting the development of public sector planning capacity, both in terms of numbers and technical expertise, and the key perspectives public sector planners bring to drive forward local priorities.
As planning budgets have been cut, income from development management has become increasingly important. In England, income from development management was equivalent to about a quarter of total spending on planning in 2009-10. By 2017-18, income from development management was greater than core funding, and equivalent to about half of total spending on planning in the country [39]. A core implication of this shift in funding is a movement away from the perception of planning as a public service aimed at achieving valuable outcomes in the public interest [40].
Misaligned incentives
Budget constraints have forced LPAs to prioritise meeting statutory obligations around development management over plan-making. Local authorities are required to have a local development plan but there are limited requirements on the detail or depth of plan-making. This has led to high variation in the depth and quality of local development plans. In 2015, 83% of local development plans in Scotland were under five years old; however, as of 2018, 42% of LPAs in England had an outdated local development plan (over five years old) [41]. While reductions in core funding for development management have been compensated by increased fees and paid services, plan-making does not have any income generating functions. This has resulted in a planning sector which is increasingly dominated by development management [42]. In England, public sector plan-making services have lost an estimated 1,000 policy planners between 2009 and 2018 [43].
Planning is primarily measured against speed and quantity targets, rather than on the quality of development outcomes. The planning systems are typically judged against their ability to manage applications and grant development permissions quickly, despite national ambitions for planning to support sustainable development objectives beyond housing supply and delivery. Limiting planning to housing supply and delivery metrics can create a perception that the system is failing, create perverse incentives for local authorities to prioritise development management over strategic planning, and fail to measure the contribution of planning in enabling quality development outcomes. Although more holistic frameworks have recently been developed and promoted, they have scarcely been used due to difficulties attributing and quantifying outcomes [44]. Despite perceptions, the planning system often performs well against current target metrics, though this varies by target and by nation. The primary indicators used are:
- Timing of planning applications. The planning systems are typically measured against percentage of planning applications determined within the statutory time periods. In Scotland, planning authorities have up to four months to reach a decision for major developments, and two months for local developments [45]. In Wales and Northern Ireland, most applications should be decided within eight weeks, unless there is the need for an Environmental Impact Assessment, in which case they are given 16 weeks [46]. In England the statutory limits are generally 13 weeks for major developments[47] and 8 weeks for minor applications [48]. Performance against these targets varies across nations. In 2017-18, 87% of all major residential planning applications in England were determined within the time target [49]. However, in Scotland, the average decision time for major development applications in the first half of 2019 was 34 weeks [50]. In Wales, only 20% of major planning applications were within the statutory time limits [51].
- Housing targets. The planning system is often measured against its success in enabling the UK Government and devolved nations to meet housing targets, despite housing delivery requiring factors beyond planning approval. In 2017‑18, local authorities in England approved planning applications for over 370,000 new homes, but only 214,000 homes were completed [52]. In Wales, over 4,000 affordable housing dwellings were granted planning permission in 2016-17, yet only roughly 2,500 were delivered [53]. This indicates that the planning system does not constrain development, and that policies that eliminate the planning application process may not necessarily solve housing shortage challenges.
Despite the constraints placed on the current planning systems, they play a key role in enabling economic, social environmental and health outcomes in the UK. The next section describes the core outcomes associated with good planning, and the role of the planning systems in delivery.
3. The value of planning outcomes to the UK
Planning can drive ambitious development outcomes by creating efficient spaces and safeguarding critical resources. The planning system shapes the built and natural environments where people work, live and interact. Through strategic spatial planning, the system can ensure that all residents and businesses have a good level of access to services and infrastructure, resources are appropriately accounted for in development decisions, and that new developments make efficient use of resources and technologies. Planning can also address potential negative impacts of development which can be harmful to human health. This section clarifies the links between the planning system and quality development outcomes (Figure 2), providing estimates of the value delivered.
Figure 2: Core quality outcomes of good planning
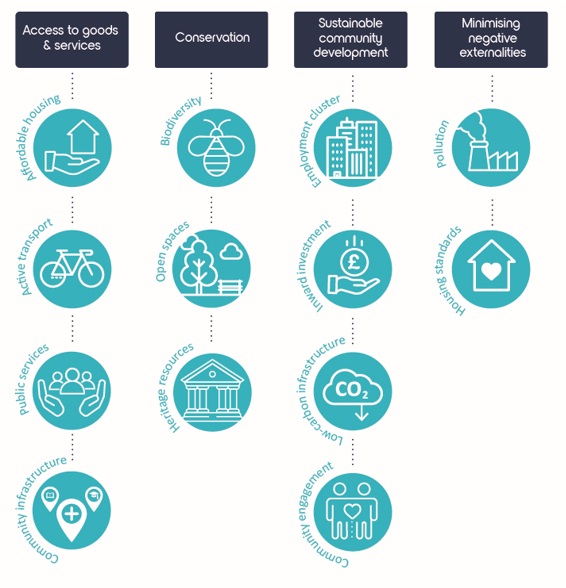
Source: Vivid Economics
Access to goods and services
Planning can ensure a good level of access to services and infrastructure which are critical for people’s health and the long-term sustainability of towns and cities. The planning system is particularly important for providing access to affordable housing, active transport infrastructure, greenspaces and public services.
Affordable housing
Affordable housing delivered through planning obligations saved UK health systems £240 million in 2019
The planning system identifies the need for affordable housing and ensures that affordable housing needs should be addressed through developer contributions. Strategic policies are informed by a local housing need assessment. Typically, an LPA will require that a proportion of housing in a new development is designated as affordable. According to the NPPF, where major development involving the provision of housing is proposed, planning policies and decisions should expect at least 10% of the homes to be available for affordable home ownership[54] [55].
Planning developer contributions have become the leading provider of affordable housing units in the UK (Figure 2). In 2019, the planning system helped to deliver nearly half of the 69,000 units of affordable housing completed in England, Scotland and Wales. Government funding for social housing in England has been declining for decades: in 1976, social housing funding stood at over £18 billion; in 2016, this figure was just £1.1 billion [56] [57] . In Scotland, fiscal support under the Affordable Housing Supply Programme has increased from £531 million in 2008-09 to £756 million in 2018-19, but planning developer contributions have still delivered approximately a third of affordable housing units built during this period [58]. Accordingly, the planning system will be integral in delivering the estimated 145,000 annual units of affordable housing needed over the next 11 years to meet housing needs in England, and to meet national targets in Scotland, Wales and Northern Ireland [59].
Access to affordable housing increases economic opportunities for low-income families. Affordable housing can bring stability to household finances by reducing rent burden and freeing up income to spend on necessities and services in their local communities [60]. Rent reductions saved low-income households over £1 billion in 2019 through reduces rates of rent and ownership. Additionally, access to affordable housing can increase opportunities for finding employment, enabling over 6,500 people to obtain jobs and providing households an additional £176 million[61] per year [62]. This also reduces the fiscal burden of the Jobseeker’s Allowance, saving more than an estimated £21 million[63] per year. Additionally, affordable housing reduces public expenditure on temporary accommodation for homeless households, which is significant and rising; councils in England spent over £1 billion in temporary accommodation between April 2018 and March 2019, increasing by 111% over five years [64].
Figure 3: New affordable housing completions due to planning contributions and share of total affordable housing due to planning contributions in England, Scotland and Wales
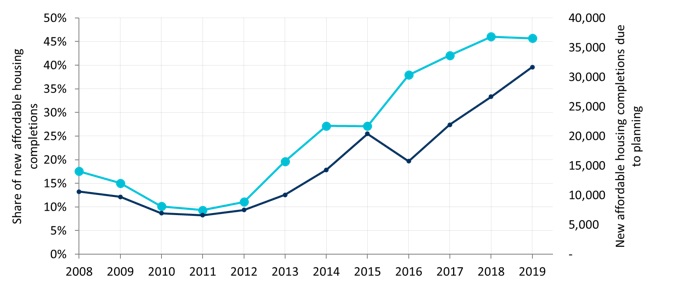
Note: Dark blue reflects new affordable housing completions. Light blue represents share of completions due to planning. Northern Ireland excluded as planning contributions typically not used for affordable housing. This assumes that 33% of all affordable housing in Scotland is due to planning contributions [65].
Source: Vivid Economics based on StatsWales, Scottish Government and MHCLG data
High quality affordable housing reduces the risk of illnesses, benefitting residents and saving the NHS at least £240 million per year. Private sector accommodations are nearly twice as likely to present a risk to a person’s health, compared to affordable housing units.[66] Private development can often bypass planning quality control processes through schemes like permitted development rights [67]. Analysis for this report shows these quality improvements benefit individuals and the NHS through several channels (Table 1):
- Reduced risk of illness. Improved housing conditions reduces the likelihood that individuals become sick due to factors associated with poor housing such as dampness, carbon monoxide, structural collapse, and electrical faults. These improvements saved the NHS an estimated £25 million[68] in 2019. Improved health has the secondary benefit of reduced absenteeism at school and work, thus contributing to those outcomes and improved overall performance [69].
- Reduced overcrowding. Overcrowding is a major risk factor in the transmission of diseases such as acute respiratory infections, meningitis, typhus and cholera [70]. The majority of affordable housing supplied through planning contributions reduces overcrowding, saving the NHS an estimated £19 million[71] in 2019 [72].
- Reduced homelessness. Since 2000, 24% of all affordable housing delivered through the planning systems in England, Scotland, and Wales has gone to previously homeless households. Analysis for this report estimates that there are currently 53,000 affordable units which house people who were previously homeless or at risk of homelessness. Homeless individuals display higher levels of mental ill-health, physical illnesses such as respiratory diseases, and drug and alcohol dependency than the general population [73]. In 2019, providing affordable housing to previously homeless individuals saved the NHS £195 million in healthcare costs.
- Mental health benefits. Affordable housing improves the financial health of the household and can reduce housing- and financial-related stress and its negative impact on mental health [74]. These mental health benefits are not included in the £240 million figure, meaning affordable housing savings to the NHS are likely even higher.
- Reduced childhood illness. Living in poor-quality housing increases the risk of severe ill-health and disability among children and young adults by up to 25 percent [75]. By providing families with access to high quality homes, affordable housing decreases this likelihood of ill-health and disability. This provides relief for the household budget, as families of children with physical health disabilities typically require an additional £1,865 per annum to achieve the same living standards of families without a disabled child [76].
Table 1: Affordable Housing in Great Britain due to planning contributions provided more than £14 billion in 2019
|
Number of units due to planning contributions (2019) |
Rent savings (£m) |
Jobs due to employment opportunities (2019) |
Healthcare savings from reduced homelessness (£m) |
Total healthcare savings (£m) |
Total benefits (£m) |
|
|
England |
28,000 |
1,100 |
5,140 |
130 |
164 |
1,400 |
|
Scotland |
3,100 |
80 |
1,230 |
59 |
68 |
184 |
|
Wales |
600 |
7 |
230 |
7 |
8 |
22 |
Note: Northern Ireland excluded as section 76 agreements have typically not been used to secure affordable housing.
Source: Vivid Economics
Active travel infrastructure
Living in a well-planned neighbourhood can provide up to 59% of the 150 minutes of NHS-recommended activity
Planning policies promote creating efficient spaces that enable safe and active travel. The NPPF, PPW, SPP and Northern Ireland SPPS all require spatial strategies to support the objectives of minimising the need to travel and increasing the opportunities for walking and cycling. Active Travel Strategies identify the key challenges inhibiting active travel and aim to promote physical activity, reduce traffic congestion[77] and improve air quality by making active travel opportunities safer and more accessible to the public. Development management then ensures proposals adhere to the plan, and raises funds for infrastructure to support active travel opportunities through planning contributions.
Active travel infrastructure enables walking and cycling, supporting population health and reducing vehicle emissions. Living in a well-planned, active-friendly neighbourhood can encourage modal shifts from car to active travel [78]. Benefits of active travel infrastructure include:
- Increased physical activity. Physical inactivity contributes to one in six deaths in the UK and costs an estimated £7.4 billion per year to business and society [79]. One of the primary reasons that people in the UK do not walk or cycle more is due to safety concerns: 24% of individuals in England cited road safety as a barrier to cycling [80]. Active travel infrastructure encourages walking and cycling, enabling 32-59% of the 150 minutes of physical activity recommended for adults [81]. Meeting this recommendation has been shown to reduce the risk of health problems such as heart and vascular disease, stroke, high blood pressure, colon and breast cancer, diabetes and depression [82].
- Reducing environmental impacts of vehicle emissions. In 2019, the transport sector emitted roughly 120 million tonnes of CO2, valued at over £8 billion [83]. Well-planned active travel infrastructure can reduce the need for short-distance car travel through providing safe and accessible platforms for residents to walk and cycle. In 2019, 58% of car trips in England were less than five miles [84].
The UK Connect2 initiative increases active travel through developing new infrastructure. The Connect2 initiative, led by sustainable transport charity Sustrans, was established to build or improve walking and cycling infrastructure at 79 sites across the UK. To be selected for a project, local planning authorities or community groups put forward applications after consulting with local partners and stakeholders. A 2014 study of the impacts of the initiative in Cardiff, Kenilworth and Southampton found that close access to the new infrastructure was a key factor in increasing walking and cycling activity [85].
Public services and community infrastructure
Ensuring a good level of access to a range of social and community infrastructure is a requirement for local planning. Local development plans should make sufficient provision for community facilities, while development management ensures funding for these through adequate planning contributions or through on-site provision in larger housing-focused development schemes [86]. New developments benefit from communities with desirable public facilities and increase demand for local public services. Consequently, developers are typically required to contribute to the cost of local infrastructure to compensate for the increased pressure on local facilities [87]. Planning authorities collaborate with local stakeholders to identify needs for meeting places, schools, libraries and hospitals [88]. In 2018-19, planning developer contributions in England included £439 million for education, £294 million for transport and travel infrastructure, and £62 million for community works [89].
Community infrastructure and public services help build inclusive communities. Community facilities delivered by the planning systems play an important role in bringing neighbourhoods together and in helping people develop life skills and resilience [90]. This infrastructure also addresses broad economic and social goals such as increasing educational outcomes, improving public health and increasing social capital in the community [91].
Conservation
Urban greenspaces in Great Britain provide £16.5 billion in environmental, health and amenity value per year
Conservation and restoration of resources can ensure access for future generations to critical amenities. Planning prevents development from infringing on key resources, and promotes efficiently planned places with access to the natural environment. All four UK primary planning policies have provisions to protect, enhance and promote access to green infrastructure and biodiverse ecosystems and to ensure that development does not result in an adverse effect on the integrity of internationally important habitats and species.
Open spaces and green infrastructure
Well-planned places provide access to greenspaces, play and sports facilities and make appropriate provisions for access in new developments. Planning authorities are responsible for protecting national parks and gardens, existing green infrastructure and ecological assets, and the Green Belt. In Wales, planning authorities are required to produce up to date inventories and maps of existing green infrastructure and identify opportunities for growth. In Scotland, The Planning Bill 2019 makes open space strategies a statutory requirement; these strategies must contain an audit of existing open space and an assessment of future requirements. In 2018-19, planning authorities in England agreed £157 million of developer contributions towards preserving open space and the natural environment [92].
Ensuring good access to greenspaces for all residents supports physical and mental health and reduced health inequalities. Greenspace can promote, protect, and assist in the process of returning to a state of good physical health and mental wellbeing. Increased provision of greenspace is associated with higher levels of physical activity [93] which reduces the risk of breast and colon cancers, diabetes and ischaemic heart disease [94]. Similarly, greater access to and use of greenspace is associated with improvements to mental health outcomes [95]. Access to greenspace is particularly important for low-income households who typically have poorer physical health, higher incidences of moderate or severe mental illness, and who typically face financial barriers to alternative exercise facilities such as community centres or membership-based gymnasiums [96].
Planning protects the £16.5 billion of health, wellbeing and environmental benefits provided by greenspaces in Great Britain each year. Greenspaces provide valuable benefits for urban populations in the UK where access to the natural environment is typically limited. Greenspaces also provide indirect services for those who do not visit by removing atmospheric greenhouse gases (GHGs) and harmful pollutants, regulating local temperature, and mitigating flood risk. An estimated 693 million visits are made to urban greenspaces in Great Britain annually. These visitors gain £15 billion each year in health and wellbeing value through reduced illnesses, reduced mortality, and increased life satisfaction.
Table 2: Greenspaces in Great Britain provide more than £16 billion in value per year
|
Carbon sequestration (£m/yr) |
Amenity value (£m/yr) |
Physical health (£m/yr) |
Mental wellbeing (£m/yr) |
Total (£m/yr) |
|
|
England |
31 |
1,500 |
5,100 |
9,400 |
16,000 |
|
Scotland |
<1 |
40 |
150 |
270 |
450 |
|
Wales |
<1 |
10 |
40 |
80 |
130 |
Note: Values are estimated using Vivid’s Greenkeeper Tool (see Appendix). Greenkeeper does not capture greenspaces in Northern Ireland.
Source: Vivid Economics
Biodiversity
Local Planning Authorities take a leading role in protecting biodiversity through biodiversity impact requirements in planning policy. Urbanisation is the third largest threat to habitat loss globally, threatening more than one-third of species at risk [97]. All four UK national planning policies[98] recognise that planning authorities have a statutory duty to conserve biodiversity and prevent adverse impacts of development on biodiversity. In England, LPAs are required to provide net gains to biodiversity: when assessing a planning application, development management is required to check that any adverse biodiversity effects should firstly be avoided, then minimised, mitigated, and, only as a last resort, compensated for [99]. In Wales, all developments are required to provide a net benefit for biodiversity and should not cause any significant loss of habitats or populations of species [100].
Protecting biodiversity from development supports ecosystems and can provide human health benefits. Biodiverse spaces include a greater variety of vegetation types, and they are better able to support diversity in insects and animals [101]. Biodiverse spaces are also more aesthetically pleasing, encourage more recreational visits to green spaces, and provide more opportunities for residents to engage with the natural environment [102]. There is also evidence that exposure to a wide range of plants, insects and animals in urban green spaces can have a positive health impact by increasing immune function [103].
Heritage resources and local culture
In 2015, heritage tourism contributed over £20 billion to UK GDP
LPAs are responsible for protecting and enhancing the historic environment. When designating potential development areas, planning authorities consider heritage and historic interests, and development management controls help ensure that new developments will not have a significant adverse effect. Planning manages heritage resources through listed buildings and heritage designation regimes. The most important historic assets often have statutory protection. As of 2016, the UK had 31 cultural, natural and mixed World Heritage Sites and England had approximately 19,854 scheduled monuments, 377,587 listed buildings and over 46 registered battlefields [104].
Heritage sites support place-making and local identity and can also play a role in attracting tourism. Historic buildings, monuments and spaces are central to local culture and character [105]. For example, the local plan in Chester, England, explicitly notes that Chester city centre attracts approximately 9 million visitors a year, primarily for Chester’s heritage assets [106]. Heritage assets increasingly managed for local growth and development through a global ‘heritage industry’ [107]. In 2015, heritage tourism contributed over £20 billion to UK GDP, including £2,1 billion from Scotland, while in 2019, heritage spaces in England attracted £17 billion in tourism spending [108].
Sustainable community development
Plan-making can enable the development of sustainable and self-sufficient communities, which provide access to jobs, low-carbon infrastructure, and community resources.
Integrated settlements
73% of planning housing permissions in England are located within 10km of a major employment cluster
The planning system facilitates economic growth and innovation by bringing together people, activities, and resources. Planning can shape urban settlement and promote business agglomeration through both proactive plan-making and development management. Strategic local development plans can outline the location of new homes and employment space to support business’ ability to locate in close proximity to the local workforce. The development management process can also regulate the density and accessibility of developments and ensure sufficient infrastructure provision through on-site provision or developer contributions.
- In England, the NPPF requires local planning authorities to set criteria, or identify strategic sites, for local and inward investment as part of the process of drawing up local development plans [109].
- In Wales, the PPW clearly identifies the role planning plays in facilitating investment through ensuring adequate infrastructure and coordinating various agencies and communities [110].
- The SPP and SPSS also highlight that, through spatial allocation, creating attractive places, and enabling the delivery of necessary infrastructure, planning can help provide the confidence required to secure private sector investment [111].
Integrated settlements provide important economic benefits to local communities. There are two main benefits:
- Reduced congestion. Development patterns managed through the planning system help reduce the distance between homes and jobs, limit commuting time. Across twelve city-regions in England, 73% of planning housing permissions were located within 10km of a major employment cluster with 10,000 or more jobs. Reducing commuting needs can enable time, fuel, and business cost savings. The direct impacts of congestion (wasted time and fuel) cost the UK economy approximately £7.8 billion per year, while the indirect impacts (for example, higher freighting costs and business fees) cost an additional £4.9 billion per year [112]. This can also reduce the need for investment in highway infrastructure to accommodate growth in road vehicle journeys.
- Improved business and worker efficiency. Spatial planning can provide the infrastructure to support business agglomeration. Firms which are spatially proximate can minimise transaction costs, share research and development activities, and benefit from social interactions between workers in the same field. On average, a 1% increase in density (inhabitants per square km) is associated with a 0.06% increase in Total Factor Productivity and a 0.04% increase in labour productivity [113]. Box 2 provides an example of how planning has facilitated business development in the UK.
|
Box 2: International Advanced Manufacturing Park Planning policy in Sunderland, England is predicted to deliver 7,000 new jobs and £400 million in business development through strategic placement of a manufacturing park. To facilitate business development in the automotive and manufacturing sectors, the Sunderland City Council and South Tyneside Council developed a joint project to release up to 150 hectares of development land for the International Advanced Manufacturing Park (IAMP). Located next to Nissan UK’s Sunderland plant, the IAMP is designated a ‘Nationally Significant Infrastructure Project’ by the UK Government. To deliver the IAMP, the councils developed a specific International Advance Manufacturing Area Action Plan and Infrastructure Delivery Plan. The IAMP acts as a central hub of resources and skills, and provides an attractive investment location for automotive, manufacturing and technology businesses. Through providing infrastructure and transport links, it is predicted to bring in over £400 million in private sector development, and over 7,000 new jobs, by 2026-27 [114].infrastructure and transport links, it is predicted to bring in over £400 million in private sector development, and over 7,000 new jobs, by 2026-27. [115] |
Despite perceptions, the planning system can be a driver of economic growth through its role in coordinating stakeholders. Planning is often cited as a barrier to economic growth due to the perceived delay, cost and uncertainty surrounding new development. However, 83% of LPAs cite infrastructure costs as a barrier to inward investment and development [116]. Through identifying and addressing key infrastructure barriers to investment and working with local partners to overcome coordination market failures, the planning system has the potential to deliver significant inwards development. Planning can also secure affordable workspace and ensure that there is a range of floorspace available so that, for example, ‘start-ups’ have premises to move on to as their business grows. Box 3 overleaf shows how the planning system can coordinate actors to enable inward investment and economic growth.
Low-carbon infrastructure
An ambitious planning system can help facilitate low-carbon development and support the UK to achieve its 2050 Net Zero target. National planning policy frameworks promote low-carbon developments and planning for renewable energy sites. Local development plans also facilitate the grid infrastructure required to support a low-carbon economy.
- The Welsh Government expects all new development that goes through the planning system to mitigate the causes of climate change through reducing energy demand and increasing energy efficiency [117];
- In Scotland, the NPF is clear that planning must facilitate the transition to a low carbon economy [118];
- In England, the NPPF requires local authorities to identify suitable areas for renewable and low carbon energy sources (and supporting infrastructure) [119]; and
- The Northern Irish SPSS requires the planning system to make use of opportunities for low carbon sources of energy wherever possible [120].
A leading example of what planning is capability of achieving, the London Plan requires developers to include on-site carbon reductions and local energy generation, leading to a 26% reduction in building emissions[121]. The London Plan (2004), developed by the Mayor of London, contains a variety of energy compliance policies for new major developments[122] over the next 20–25 years [123]. This includes a net zero carbon target for major residential developments. The Plan also requires all major development proposals to include a detailed energy assessment that demonstrates how the target will be met through energy efficiency or renewable energy consumption [124]. The planning target requires a minimum on-site carbon reduction to be achieved and allows for any carbon shortfall to be paid as a cash-in-lieu contribution into the relevant local authority's carbon offset fund. Since 2004, 113 developments built under the London Plan have provided annual energy savings of £1.7-3 million per year [125].
Community engagement
Planning can support local neighbourhoods to shape development, retain their identity and encourage community involvement in the planning process. The planning system does not proceed by top-down control from government, but by the development of locally specific development plans and the determination of permissions decided locally. Local councillors represent their local community through their involvement in plan-making and development management democratic decision-making processes.
- In England, communities can prepare neighbourhood plans with legal weight and can grant planning permission for the development they desire through a ‘neighbourhood development order’ (NDO). Once accepted by the LPA, NDOs allow local communities to determine what forms of development in their area should be permitted without the need for full planning permission [126].
- In Northern Ireland, councils have a statutory duty to implement community planning through producing a Community Plan based on local engagement [127].
- In Scotland, a community planning system is in place in which LPAs work together with local communities to design and deliver better services. Community participation is at the heart of Scottish community planning, and applies in the development and delivery of plans, as well as in their review and reporting [128].
- The Welsh Government encourages LPAs to work with local communities to produce Place Plans. Place Plans are a mechanism for communities to engage with the planning process and for planners to support place-making initiative with local people. They may be prepared at the initiation of the local community and are a powerful tool to promote collaborative action to improve well‑being and placemaking [129].
Minimising negative externalities
Planning controls development which could have negative impacts on public health. This includes regulating the quality of housing developed and ensuring that developments do not contribute to excessive air, water, or noise pollution.
Quality standards
Homes developed through planning permission are three times more likely to meet National Space Standards
The planning system plays a critical role in ensuring new developments support people’s health and wellbeing. Good spatial planning helps place new developments in appropriate locations (for example, avoiding residential development in industrial areas), while the development management system ensures minimum housing quality standards are met. When the system is bypassed, low quality housing units can have severe impacts on residential wellbeing.
Bypassing the planning system can lead to poorer quality housing, threatening public health and safety. This has been seen in England through the use of Permitted Development Rights legislation (PDR). In England (apart from a few areas of agreed exemption), it has been possible since 2013 to convert buildings formerly in office, agricultural, storage, light industrial and retail uses into residential use without needing planning permission. This deregulation was a policy decision taken by central government, primarily to boost the supply of housing. Under PDR, the LPA cannot regulate the purpose of the conversion or consider design issues, including space standards. This can lead to a higher supply of housing at the expense of quality, health, and wellbeing. In England, comparing homes delivered through permitted development rights and those consented through full planning permission, reductions in planning can lead to [130]:
- Inadequate housing space– just 22-30% of PDR units meet Nationally Described Space Standards, compared to 73-94% of units created through full planning permissions
- Low mix of unit types – 77% of PDR units are studio or 1-bedroom flats, which are unlikely to meet real needs and may lead to overcrowding
- Poor natural light in homes- 72% of the PDR units have windows only on one wall, compared to just 29.5% created through planning permission
- Limited access to amenity space- just 3.5% of PDR units benefit from access to private amenity space
- Poor spatial positioning– PDR schemes are eight times more likely to be in commercial areas than planning permission schemes
- Loss of affordable housing– planning obligations generally cannot be agreed for PDR units, leading to a loss of affordable housing delivered through the planning system
Air pollution
Planning policies prevent excess air pollution, which costs the UK £9-19 billion each year
Spatial plan-making and development management controls ensure that development does not lead to excessive air pollution. Air pollution is a significant factor in respiratory disease outcomes and early mortality in the UK. Long term exposure to man-made air pollution in the UK has an annual effect equivalent to 28,000 to 36,000 deaths [131]. Through managing pollution impacts from new developments, the planning system can help support population health and reduce healthcare costs [132]. The independent review of the Cleaner Air for Scotland Strategy explicitly recommends ensuring that new developments do not worsen air quality through efficient design. This includes promoting active travel options connecting up with existing bus and rail services [133].
National planning policies provide frameworks for planning to contribute towards meeting national objectives for air pollutants. Under these frameworks, local development plans should take into account Air Quality Management Areas and Clean Air Zones, and identify appropriate locations for potentially polluting industrial development to protect human health and biodiversity [134]. Development management regulations can prevent excess pollution by requiring an air quality assessment for major developments or offsetting planning obligations. The process also brings an opportunity to reduce overall emissions by installing new, cleaner technologies. Examples of planning for air quality include:
- The BREEAM for homes in London, under which most new social housing is required to install ultra-low NOX boilers [135]. Many local authorities have also published planning documents on air quality to provide guidance to developers.
- Also in London, supplementary planning guidance requires that developments do not lead to further deterioration of air quality by establishing benchmarks for emissions which developments must comply with [136].
- The West Yorkshire Low Emissions Strategy Group has prepared a three-stage process to assess the potential air quality impacts of new development. This involves screening out developments with air quality small impacts, quantifying emissions generated for larger developments, and assigning a monetary value to defines the value of required mitigation [137].
4. Opportunities for raising ambition
Like any good public service, the planning system requires resources and capacity to deliver outcomes efficiently, effectively, and equitably. As Section 3 details, planning plays a critical role in supporting sustainable development in the UK. This has been reinforced by the UK Government’s recently published Planning White Paper which highlights the essential role of planning in delivering sustainable communities.[138] However, the planning system can only continue to deliver value and promote the UK’s more ambitious development objectives if it is properly resourced. Section 0 describes a model for treating investment in planning as an essential public service, and Section 0 provides a vision for ambitious planning outcomes and the value of prioritising planning in the UK.
Investing in planning as an essential public service
There is currently an imbalance in how planning is funded and the planning functions which deliver benefits. The majority of planning expenditure is on development management, and plan-making activities are unable to generate revenue. While development management adds value in its process, decisions taken are intended to be plan-led. Accordingly, when plan-making is under-resourced, the framework for making development decisions may not reflect strategic priorities and can also impact the amount of time taken to develop and adopt a plan.
There is an opportunity to increase the impacts of the planning system through investment and re-prioritisation of plan-making. The theory of change detailed in Figure 4 shows a model for ambitious planning which emphasises place-making and quality outcomes.
Figure 4: Funding is required to deliver the UK’s sustainable development priorities (Source: Vivid)
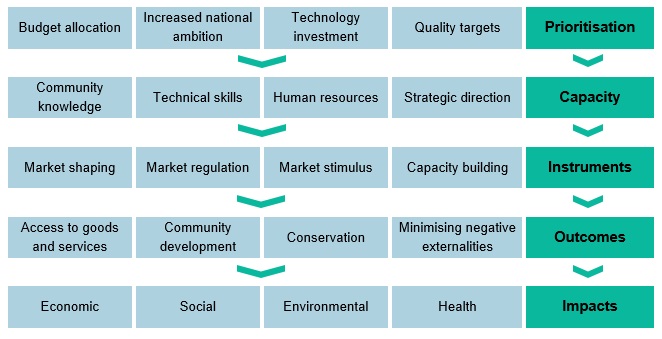
Prioritisation of planning requires giving the system the resources it needs to build capacity and use the tools at its disposal. Strategic plan-making requires technical skills and a deep understanding of community needs and priorities. In addition, planners are currently tasked with a time and resource-intensive development process. Investment can help support the shift from a largely reactive, regulatory planning system, to a proactive and strategic planning system. Prioritising the planning system and building capacity could also include non-financial actions, such as freeing up resources by reducing needlessly burdensome regulations and changing performance targets to measure quality instead of speed or efficiency. Planning investments to support capacity could include:
- Financial investment in planning departments;
- Increasing the number of public and private planners employed;
- Investing in efficiency-saving digital technologies; and,
- Funding for specialist knowledge, such as ecological preservation and urban design.
Well-resourced planners can use a mix of policy instruments to deliver strategic outcomes. Planning cannot take a ‘one size fits all’ approach to development – it requires local knowledge and skill sets to determine the appropriate actions needed to achieve strategic priorities. Planners with technical skills and institutional knowledge can use a variety of planning policy instruments, as set out in Table 5 in the Appendix. However, proposed changes to the planning system could put the tools planners use at risk. For example, the Planning White Paper proposes to significantly alter development management activities. This risks the market regulation and quality control function of planning and could lead to lower quality housing. Box 4 addresses the ambitions laid out in the Planning White Paper and resources needed to achieve them
Increasing the capacity of the planning system has the potential to deliver significant value for money. Planning investment can deliver value primarily through:
- Improved health outcomes and economic opportunities: The current planning system drives health and economic outcomes in towns and cities (Section 3). Increasing the capacity of Local Planning Authorities can achieve higher health, wellbeing, environmental and economic ambitions of local development plans.
- Reduced inequalities: Planning is critical in providing affordable housing, quality housing and ensuring equitable access to goods, services and jobs. Additionally, spatial planning can enable access to greenspaces and community infrastructure for deprived populations, which is key for supporting better health outcomes. Higher expenditure on planning can enable planners to redress these economic, social, environmental and health inequalities.
- Reduced inequities: Inequities in LPA resources can deepen regional inequalities. Currently, planning services primarily serve the most well-off areas, despite the fact that planning supports health and housing for all [139]. Local authorities in areas with poor health and social outcomes are also harder hit by budget cuts to planning. Spending decisions are influenced by statutory obligations and social care needs, which can enable further de-prioritisation of planning [140]. Recently, COVID-19 has demonstrated the need for planning to support adaptation to new living, working and travelling patterns, particularly in providing active travel infrastructure. Wealthier areas, with the capacity to adapt to these new needs, are much more likely to be able to serve residents.
- Safeguarding resources and preventing future costs: Investment in planning is an investment in the infrastructure, resources and spaces which will be used by future generations. Conversely, poorly planned and managed urban development can create costs when there is a lack of adequate services and housing and potentially expose people to hazards. Construction quality which is done to the lowest cost also creates future cost burdens for homeowners and public bodies with maintenance responsibilities.
|
Box 4: Planning for the Future White Paper The UK Government’s ‘Planning for the Future’ White Paper sets out a package of proposals for reforming the English planning system which shift the focus of planning to place-making and quality design. The White Paper recognises that the planning system is integral to delivering national ambitions for sustainable development. The White Paper proposes five major areas of reforms:
The reforms proposed in the White Paper have the potential to improve place-making and value delivered through the planning system. All five proposed reforms are consistent with the ambitions set out in this report for delivering more value through planning. In particular, the first and third reforms have the potential to enable planners to better deliver on climate change ambitions, quality housing and economic development. Streamlining the planning process could reduce the burdensome regulations planners currently face, and enable them to allocate more time, energy and resources on strategic plan-making. Additionally, shifting the focus to quality design and sustainability can support climate change efforts and create more economic opportunities. However, the White Paper’s proposed funding approach is incongruous with its ambitions to deliver better quality through planning. While the White Paper proposes changes to securing funding for infrastructure which could provide more flexibility for local authorities to meet community needs, it does not address existing cuts to budgets that are straining public planners. The White Paper argues that the cost of operating the new planning system should be funded by developers and landowners, the principal beneficiaries of planning. This argument against public funding focuses solely on the real estate aspects of development and fails to recognise the important public benefits of planning as laid out in this report and is potentially inconsistent with the White Paper’s ambition to support local and national objectives. Additionally, the White Paper makes minimal funding provisions for proposed digitisation and upskilling in the planning system. It offers “time limited funding” to be made available by the Government to support local authorities’ transition. While it is unclear how much funding will be provided, this is likely to be a significant underestimate of the needs, and overly optimistic on timescale, particularly for digitisation. A 2012 UK Government report found that digitising government services could save billions, but could take up to 17 years for complete digital uptake [141]. The NHS has also built digital ambitions into its long-term plans, with estimates as high as £13 billion needed for the transformation [142]. The UK Government should invest in the new planning system in line with the public services it aims to deliver. The Planning White Paper describes an ambitious vision for planning and development, but without sufficient resources, the Government risks creating a new system with the same deficiencies. |
Investing in planning and place requires new models of funding. Most planning expenditure is on development management, with the greatest spending cuts in recent years seen in planning policy. This is partly due to increasing statutory obligations on development management, and partly due to the functions of planning which generate revenue. In Scotland, the government recently increased major application planning fees to try achieve full cost recovery. Despite this, fee income only recovered 66% of application processing costs, signalling that there are still significant funding gaps [143]. Many strategic planning services are non-fee generating, including local plan-making, community engagement, heritage conservation, development of design codes, and community engagement. There are some streams of funding available for plan-making, such as the Planning Delivery Fund, financial support for neighbourhood planning and the New Homes Bonus, but these sources are limited. The Planning Delivery Fund could be greatly expanded in size and scope to incentivise quality outcomes, joint working, community participation, the digitisation of part of the planning process, and climate ambitions.
What could an ambitious and well-resourced planning system deliver?
Prioritising the planning system can enable planners to deliver on more ambitious development and recovery targets. The following sections outline opportunities for planning to prioritise affordable housing, active transport, green infrastructure and low-carbon infrastructure. These four outcomes are just a sample of the potential of planning to unlock economic value and healthier populations in the UK. Key benefits include:
- NHS savings from healthier populations living in higher quality housing with better access to amenities;
- Cost- and energy-saving opportunities through low-carbon development; and,
- Reduced health and economic inequalities in deprived areas.
Affordable housing
Providing sufficient affordable housing could save UK households over £5 billion per year
Without the planning system, the UK is unlikely to meet national affordable housing targets. The Scottish, Welsh and Northern Ireland governments have all adopted ambitious affordable housing targets, while recent research in England suggests that 145,000 new affordable homes will need to be build each year to meet affordable housing needs [144]. The planning systems have been integral in the provision of affordable housing in the last few years. Since 2008, planning contributions have provided 25% of all affordable housing built in Great Britain.
To achieve ambitious national targets, planners will need to identify where affordable housing is needed, enforce quality standards, ensure new homes have good access to amenities, support community cohesion, and coordinate developer contributions. As discussed in Section 0, the planning systems have delivered important health and economic benefits through coordinating affordable housing delivery. Planning will continue to play an important role in meeting national affordable housing targets, ensuring quality homes are built in the right places.
Table 3 shows the value the planning system would achieve by meeting national targets. This would result in annual benefits of:
- £5.2 billion saved due to rent and ownership cost reductions;
- £142 million in savings to the NHS due to reduced risk of illness, overcrowding and homelessness;
- £128 million in household income due to enhanced employment opportunities; and,
- £15 million in fiscal savings due to reduced unemployment benefits. Additional savings from reduced expenditure on temporary accommodation for homeless households mean that the fiscal impact is likely to be even greater.
Table 3: Ambitious affordable housing targets in the UK could provide benefits of over £5.4bn/yr
|
Housing target |
Healthcare savings (£m/yr) |
Rent savings (£m/yr) |
Employment opportunities (£m/yr) |
Unemployment benefit savings (£m/yr) |
Total (£m/yr) |
|
|
England |
145,000 |
120 |
5,000 |
120 |
14 |
5,200 |
|
Scotland |
50,000 |
18 |
140 |
8 |
1 |
170 |
|
Wales |
20,000 |
4 |
25 |
3 |
<1 |
32 |
|
Northern Ireland |
1,850 |
2 |
11 |
1 |
<1 |
14 |
Source: Vivid Economics
Active transport
Shifting just 10% of car trips under 5 miles to cycling could lead to 1,200 fewer deaths per year in the UK
The planning systems can play a key role in encouraging active travel in the UK through identifying new opportunities and facilitating infrastructure investment. Active travel is currently impeded by a lack of safe and accessible infrastructure. In England, 52% of all trips under 5 miles are travelled by car, largely due to road safety concerns [145]. When asked what would encourage individuals to cycle more, the most common answers included safe cycle lanes and segregated cycle paths, suggesting that many of the short car trips could be avoided with adequate cycling infrastructure [146]. The COVID-19 pandemic has created urgency in building active transport infrastructure as many people seek to avoid interaction on public transportation. The UK Government has responded by setting up temporary active travel interventions and announcing £2 billion in funding to boost cycling and walking during and after the lockdown [147].
Promoting active travel through planning could help reduce short car trips and increase physical activity, saving the UK economy £2.6 billion each year. Providing active transport infrastructure requires community engagement to identify where active travel is most needed, spatial planning, funding for infrastructure and stakeholder coordination. Current planning systems encourage LPAs to promote active transport infrastructure, but there are limited requirements or resources to do so, and are typically only available in higher income areas. Providing planners with the resources to shift of just 10% of car trips under 5 miles to cycling would result in significant health, environmental and social benefits:
- 1,200 fewer deaths per year in the UK, valued at over £1.8 billion;
- 26 million more working hours per year due to reduced short-term sick leave, valued at over £500 million; and,
- 430,000 fewer tonnes of CO2, valued at £29 million.
Green infrastructure access
Strategic greenspace planning could deliver £78m/year in health value to the most deprived neighbourhoods
Urban planning can maximise the potential health benefits of greenspace through strategic placement which prioritises improving access for new and/or existing residents. This is stated as a key aim of the UK Government’s recently published Planning White Paper, the SPP and NPF, PPW and SPSS. Recent work conducted by Vivid Economics for the National Trust suggests that ensuring access to greenspace in the most deprived neighbourhoods in Great Britain would create additional health services valued at £78 million annually. The report found that adding 156 new greenspaces across various urban locations, an additional 312 hectares in total, was sufficient to provide a reasonable standard of access to 150,000 residents living in the most deprived areas in Great Britain [148], and that doing so results in additional physical health and mental wellbeing benefits valued at £28 million and £49 million, respectively, on an annual basis. Elevating access to this standard across the UK would likely result in significantly more health benefits. For example, previous estimates have suggested that extending good levels of access to the entire population of England could result in savings to the NHS of £2.1 billion annually through improved physical health outcomes alone [149].
Similarly, improving the quality of existing greenspaces with additional facilities can attract higher visitation and unlock greater health benefits. Although greenspace improvements may not increase access for potential visitors, higher quality parks that offer a variety of key facilities typically attract more annual visits than parks that do not. For example, a recent survey conducted in the city of Leeds found that 24% of respondents reported lack of facilities as the primary reason why they did not visit their nearest park the most often [150]. Vivid Economics has recently explored the potential benefits of improving existing greenspaces that lack facilities and amenities for visitors for the whole of Great Britain. By these estimates, significantly increasing the number of facilities in medium-to large-sized greenspaces, including public toilets, children’s play areas, and café-like amenities, could increase annual visits to greenspaces in Great Britain by as much as 67%. An increase in greenspace visits of this magnitude would support substantial additional benefits to mental wellbeing and physical health – approximately £10 billion in total per year [151].
Poorly planned greenspaces are a missed opportunity to support broader public health priorities. A poorly planned greenspace is likely to deliver considerably less benefits for human health than a well-planned greenspace. For illustration, a small pocket consisting of four deprived LSOAs was identified as having a low access to greenspace in the town of Blackpool, England, meaning that the majority of residents live more than 800 metres from an adequately sized greenspace (Figure 6 in the Appendix). Analysis for this report finds that a well-planned greenspace delivers 500% more value than a poorly planned greenspace. Specifically, planning the greenspace to feature amenities and improving location access doubles estimated visits and leads to an additional £100,000 in physical and mental health benefits annually (see the Appendix).
Low-carbon infrastructure development
Energy savings in new developments could save 19 million tonnes of CO2 (£243 million-1.3 billion) per year
The planning system can prevent locking-in inefficient, high-carbon infrastructure that will be used for decades. Through stringent climate requirements, the planning system has the potential to avoid significant carbon lock-ins from fossil-fuelled infrastructure that make it difficult to shift to lower-carbon pathways. This could include requirements for on-site carbon reductions and utilising renewable energy generation. As discussed in Section 0, the London Plan (2004) and the newly proposed London Plan are leading examples of a local development plan supporting climate ambitions. London successfully achieved these reductions by providing resources such as energy assessment and carbon offset guidance and monitoring reports [152]. However, London planners are significantly better-resourced than much of the rest of the UK. In 2017-18, London authorities spent nearly £6 per person on planning policy, while areas in the North West, West Midlands, and Yorkshire only spent around £3 per person [153].
Enabling LPAs to proactively prioritise decarbonisation can generate important savings to the economy and support the net-zero transition. Analysis for this report estimates that if emissions reductions achieved under the London Plan were extended to all major developments[154] granted planning permission in the, this would lead to annual CO2 savings of nearly 19 million tonnes,[155] valued at £243 million to £1.3 billion.
Summary
Limited resources and ambition for planning to deliver quality outcomes can create a vicious cycle of low-quality development and reduced confidence in the planning system and local authorities. Development outcomes are one of the most visible products of local authorities. When outcomes fail to meet local objectives and needs, communities may reduce support for local institutions. According to the UK Government’s Planning White Paper, the planning system has lost the trust of the public, with 49% and 36% of the public distrusting developers and local authorities respectively [156]. In Wales, individuals are frustrated as they believe planners focus too much on development applications, and not enough on creating and supporting more sustainable and lively communities [157]. Conversely, investing in an ambitious planning system could create a ‘virtuous’ cycle where high-quality outcomes build trust in local institutions.
Figure 5: Starving the planning system of resources and capacity erodes confidence in institutions
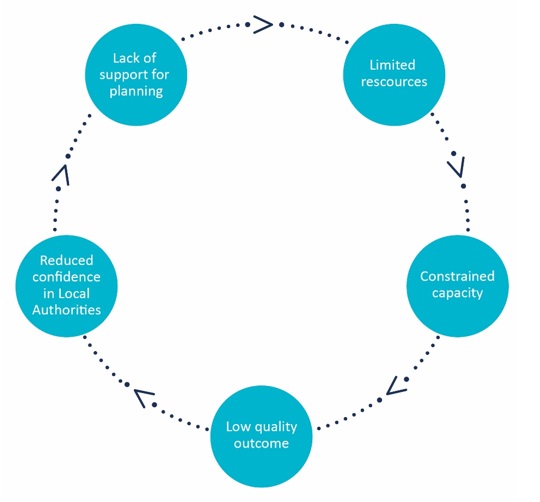
Source: Vivid Economics
Local communities are increasingly taking a driving role in determining local economic, social and environmental objectives, through democratic representation, lobbying and council’s procurement, policy and practice. For example, in recent years, many local authorities have designated local ‘climate emergencies’ and have increased their focus on the delivery of public health and community objectives. Planners are central to the delivery of these localised democratic ambitions. The UK Government’s Planning White Paper emphasises the importance of such local democratic oversight in ensuring legitimacy [158].
Enabling the planning system to deliver on its potential is not only integral to sustainable development, but failing to do so is a missed opportunity. Delivering on the objectives set out in the UK Planning White Paper requires recognition that planning is an essential service, and funding it according to its importance. As detailed in previous sections of this report, the planning system is linked to nearly all aspects of sustainable development. Failing to appropriately equip planners with the resources and capacity to deliver development in the public interest is costly to local authorities, the NHS, businesses and individuals. The COVID-19 pandemic has reemphasised the critical role planners play in delivering the needs of local communities and driving sustainable recovering from the pandemic. In a precarious economy with urgent social and environmental challenges ahead, recovery packages need to be carefully designed and deployed, placing planners in a key position [159].
Methodology Appendix
Affordable housing benefits
Affordable housing benefits are estimated for the affordable housing units which are directly attributable to planning contributions. Data sources for affordable housing supply and share delivered through developer contributions are laid out in the table below.
|
Nation |
Affordable housing supply[160] |
Developer contribution share |
Share of affordable housing to previously homeless[161] |
|
England |
|||
|
Scotland |
|||
|
Wales |
|||
|
Northern Ireland |
N/A |
N/A |
N/A |
After calculating the total stock of affordable housing delivered through developer contributions in England, Scotland and Wales, we estimate the share of units which are high quality (do not present a serious risk to a person’s health and safety) and that reduce overcrowding[169]. Assumptions used to make these calculations are laid out in the table below.
|
Parameter |
Unit |
Value |
Source |
|
Proportion of affordable housing that presents a serious risk to a person’s health and safety (England) |
% |
6% |
|
|
Proportion of affordable housing that presents a serious risk to a person’s health and safety (Wales) |
% |
7% |
|
|
Proportion of affordable housing that presents a serious risk to a person’s health and safety (Scotland) |
% |
0% |
|
|
Probability that new affordable unit leads to decreased overcrowding[170][171] |
% |
89% |
|
|
Proportion of affordable housing units in Scotland due to s75 obligations |
% |
33% |
Planning to meet the need: Delivering affordable housing through the planning system in Scotland |
NHS Benefits of Affordable Housing
We estimate the health savings from high-quality housing (only for households which were not previously homeless), health savings from reduced overcrowding, healthcare savings from reduced GP visits and health savings from reduced homelessness using the following equations:
- NHS savings from high-quality affordable housing = number affordable housing units * % high-quality * % to non-homeless * percentage point reduction in likelihood of poor quality unit (% poor quality units in private sector - % poor quality units in AH) *NHS savings from health conditions associated with poor housing (per unit)
- NHS savings from reduced overcrowding = number of affordable housing units * probability that a unit leads to decreased overcrowding *NHS savings of reduced overcrowding (per unit)
- NHS savings from reduced GP visits = number of affordable housing units * % high quality * average household size in UK *annual decrease in GP visits (per person per year) * average cost of GP visit
- NHS savings from reduced homelessness = social rent housing units * % of units to previously homeless * average household size of previously homeless * NHS savings from reduced homelessness (per person)
Data and assumptions used in these calculations are laid out in the table below.
|
Parameter |
Unit |
Value |
Source |
|
Proportion of affordable housing that presents a serious risk to a person’s health and safety (England) |
% |
6% |
|
|
Proportion of affordable housing that presents a serious risk to a person’s health and safety (Wales) |
% |
7% |
|
|
Proportion of affordable housing that presents a serious risk to a person’s health and safety (Scotland) |
% |
0% |
|
|
Proportion of private sector home that present a serious and immediate risk to a person’s health and safety (England)[172] |
% |
15% |
|
|
Annual number of affordable housing unit completions attributable to s106 (Wales, 2017) |
# |
4% |
|
|
NHS savings of reduced overcrowding (per unit) |
£ |
96 |
|
|
Average household size in UK[173] |
# |
2.3 |
|
|
Annual decrease in GP visits (per person per year) |
# |
1 |
Assessing the social and economic impact of affordable housing invmt |
|
Parameter |
Unit |
Value |
Source |
|
Cost of GP visit (NHS cost) |
£ |
45 |
|
|
Children living in AH (per unit) |
# |
2 |
|
|
Average risk of severe ill health or disability (children) |
% |
7% |
|
|
Reduced risk of severe ill health or disability (children) |
% |
20% |
|
|
Annual cost of severe ill health or disability |
£ |
1,865 |
The cost of mental and physical health |
|
NHS savings of reduced excess cold (per unit annual saving)[174] |
£ |
640 |
|
|
NHS savings of reduced fires (per unit) |
£ |
195 |
|
|
NHS savings of reduced dampness (per unit) |
£ |
292 |
|
|
NHS savings of improved food safety (per unit) |
£ |
116 |
|
|
NHS savings of reduced carbon monoxide (per unit) |
£ |
97 |
|
|
NHS savings of reduced structural collapse (per unit) |
£ |
86 |
|
|
NHS savings of reduced electrical problems (per unit) |
£ |
134 |
|
|
NHS savings of improved lighting (per unit) |
£ |
115 |
|
|
Parameter |
Unit |
Value |
Source |
|
NHS savings of improved water quality (per unit) |
£ |
124 |
|
|
NHS savings of reduced excess heat (per unit) |
£ |
94 |
|
|
Average homeless household size in UK |
# |
1 |
Conservative assumption |
|
Health cost per rough sleeper[175] |
£ |
4,000 |
Economic Benefits of Affordable Housing
To estimate the household income support benefits from affordable housing, we estimate the savings from reduced rent per year. Affordable/intermediate rent has a cap of 80% of market rent. Conservatively, we assume it all to be exactly 80%, thus saving renters 20% of market rent.
- Social rent savings = # social units to non-homeless * (average weekly private rent - average weekly social rent) * 52
- Affordable/Intermediate rent savings = # affordable/intermediate units to non-homeless * (private weekly rent * 20%) * 52
- Ownership income support = # of units sold for ownership * average unit size (square feet) * savings per square foot compared to market rate
We also estimate the benefits of increased employment opportunities to residents living in affordable housing units through increased probably of employment.
- Income support from increased employment opportunities = Number of affordable housing units * number of adults who may find new employment per household * increased probability of employment from moving from private sector to social housing * weighted average annual employment opportunity benefit (relative to unemployment benefits)
Lastly, we estimate the fiscal benefits of affordable housing from unemployment benefit savings.
- Unemployment benefits savings = Number of affordable housing units * number of adults who may find new employment per household * increased probability of employment from moving from private sector to social housing * weighted average annual unemployment benefit
Assumptions and sources for the economic benefits calculations are laid out in the table overleaf.
|
Parameter |
Unit |
Value |
Source |
|
Median private weekly rent in England (2019, p/w) |
£ |
175 |
|
|
Median private weekly rent in Scotland (2019, p/w) |
£ |
115 |
|
|
Median private weekly rent in Wales (2019, p/w) |
£ |
104 |
|
|
Median social weekly rent in England (2019, p/w) |
£ |
85 |
|
|
Median social weekly rent in Scotland (2019, p/w) |
£ |
77 |
|
|
Median social weekly rent in Wales (2019, p/w) |
£ |
92 |
|
|
Affordable rent as a proportion of private rent (England) |
% |
80% |
|
|
Intermediate rent as a proportion of private rent (England) |
% |
80% |
|
|
Intermediate rent as a proportion of private rent (Wales) |
% |
80% |
|
|
Average house size in UK |
sq feet |
818 |
|
|
Savings per square foot[176] |
£ |
130 |
|
|
Probability of employment |
% |
76% |
|
|
Increased probability of employment moving from private sector to social housing |
PP |
0.03 |
Assessing the social and economic |
|
Median weekly earnings for full-time employees (2019) |
£ |
585 |
|
|
Parameter |
Unit |
Value |
Source |
|
Number of adults who may find new employment per household |
# |
1 |
Conservative assumption |
|
Max weekly unemployment benefits (<25) |
£ |
59 |
|
|
Max weekly unemployment benefits (>=25) |
£ |
74 |
Ambitious affordable housing scenario benefits
The ambitious affordable housing scenario estimates the potential annual benefits of achieving affordable housing targets across UK nations, assuming that the new units would be delivered through and be attributable to the planning systems. We assume that the per-unit benefits for new units would be equal to the per-unit benefits by nation achieved in 2018-19. We use the stated national affordable housing targets and calculate the annual number of affordable housing units needed to achieve these targets (laid out in the table below). Although Northern Ireland does not currently deliver affordable housing through the planning system, the high ambition scenario reflects the potential benefits if the planning system were to enable the nation’s affordable housing targets. For the illustrative purposes of the scenario, we assume the per-unit benefits in Northern Ireland would be the same level as achieved in Wales. Assumptions and sources for the scenario calculations are laid out in the table below.
|
Parameter |
Unit |
Value |
Source |
|
Annual units of affordable housing needed over the next 11 years to meet housing needs in England |
# |
145,000 |
|
|
Annual units under Scottish affordable housing target (50,000 by 2021) |
# |
10,000 |
|
|
Annual units under Northern Ireland affordable housing target |
# |
1,850 |
|
|
Annual units under Wales affordable housing target (20,000 by 2021) |
# |
4,000 |
|
|
Annual units of affordable housing needed over the next 11 years to meet housing needs in England |
# |
145,000 |
|
|
Parameter |
Unit |
Value |
Source |
|
Annual units under Scottish affordable housing target (50,000 by 2021) |
# |
10,000 |
|
|
Annual units under N Ireland affordable housing target |
# |
1,850 |
|
|
Annual units under Wales affordable housing target (20,000 by 2021) |
# |
4,000 |
Active travel ambition scenario
The active travel ambition scenario estimates the benefits of shifting 10% of current car trips that are currently made that are less than 5 miles to cycling trips. We estimate the physical health and reduced absenteeism benefits from the increase in cycling time and the reduction in GHG emissions from the reduced car travel. To estimate the new distance travelled by bicycle (and the reduced distance travelled by vehicle) we use Department for Transport National Travel Survey Statistics on private car travel. We estimate the average number of car trips made by each person in England which are under 1 mile, between 1 and 2 miles, and between 2 and 5 miles. We assume that the number of trips under 5 miles per person per year in Scotland, Wales and Northern Ireland is comparable to the estimate figure for England. We calculate the distance and time of these journeys using the average distance of the categories.
Physical activity benefits
Physical health benefits of increased cycling are estimate in terms of the value of reduced risk of mortality:
- Increase in distance cycled per week = (number of car trips shifted (per person per year) * average distance per trip)/52
- Increased time spent cycling per week = Increase in distance per week/average speed
- Increase in METh/week = increased time per week * average cycling MET
- New relative risk = exp((ln(relative risk for all-cause mortality for cycling)/11.25)*increase in METh/week)
- Number of death avoided = Adult population in UK * background mortality * (1 - relative risk)
- Monetary value of saved deaths = number of deaths avoided * value of a prevented fatality
Reduced absenteeism benefits due to improved physical health from cycling are estimated in terms of the value of the reduction in sick days.
- Reduced absenteeism due to physical activity = average number of sick days per person per year * % reduction in sick days due to increased physical activity * average daily hours worked * average gross hourly cost to employers * working population size in UK * 10% assumption
Assumptions and data sources for these calculations are laid out in the table overleaf.
|
Parameter |
Unit |
Value |
Source |
|
Shift of car trips to cycling |
% |
10% |
Scenario assumption |
|
Adult population of UK (2019, 15-64) |
# |
42,460,865 |
|
|
Mean distance of trip under 1 mile |
miles/trip |
0.5 |
Assumption |
|
Mean distance of trip 1-2 miles |
miles/trip |
1.5 |
Assumption |
|
Mean distance of trip 2-5 miles |
miles/trip |
3.5 |
Assumption |
|
Average cycling speed (Eng) |
miles/hour |
8.8 |
|
|
Average cycling MET |
|
6.8 |
|
|
Relative risk for all-cause mortality for cycling |
per 11.25 METh/week |
0.9 |
|
|
Relative risk anchor |
|
11.25 |
|
|
Background mortality rate (15-64)[177] |
number of deaths/population |
0.0024 |
|
|
Value of a prevented fatality |
£ |
1,563,002 |
|
|
Average working days lost due to sickness (per person per year) |
# |
4.4 |
|
|
Parameter |
Unit |
Value |
Source |
|
Reduced short-term sick leave to due 30 min physical activity |
% |
0.25 |
|
|
Average gross salary cost (per hour) |
£/hour |
19.27 |
|
|
Average hours worked (2019, daily) |
hours |
7.44 |
|
|
Working population in the UK |
# |
32,740,000 |
|
|
Share of working population that increases physical activity by 30 minutes |
% |
10% |
Assumption |
GHG savings
Greenhouse gas savings are calculated for the estimated reductions in diesel, petrol and electric vehicle use. Savings are calculated separately for diesel, petrol and EV, assuming the reduction in mileage is distributed across vehicle types proportionately to the 2019 shares of passenger car registrations. The value of savings is based on the value of non-traded carbon.
- Reduced GHGs from modal shift to cycling = (Number of car trips shifted per person per year * mean distance travelled per trip (miles) * kg CO2 emissions per mile * adult population)/1000 * value per tonne CO2
- kg CO2 emissions per mile = (litres or kWh per 100 km * CO2 emissions per kWh or litre)/miles per 100km
Assumptions and data sources for these calculations are laid out in the table below.
|
Parameter |
Unit |
Value |
Source |
|
Shift of car trips to cycling |
% |
10% |
Scenario assumption |
|
Adult population of UK (2019, 15-64) |
# |
42,460,865 |
|
|
Mean distance of trip under 1 mile |
miles/trip |
0.5 |
Assumption |
|
Parameter |
Unit |
Value |
Source |
|
Mean distance of trip 1-2 miles |
miles/trip |
1.5 |
Assumption |
|
Mean distance of trip 2-5 miles |
miles/trip |
3.5 |
Assumption |
|
Non-traded price of carbon (2019) |
£/tCO2e |
67.0 |
|
|
Share of new car registrations (diesel, 2019) |
% |
66% |
|
|
Share of new car registrations (petrol 2019) |
% |
27% |
|
|
Share of new car registrations (electric, 2019) |
% |
7% |
|
|
CO2 emissions per litre of burnt fuel (petrol) |
Kg CO2/litre |
2.1 |
|
|
CO2 emissions per litre of burnt fuel (diesel) |
Kg CO2/litre |
2.5 |
|
|
CO2 emissions per Kwh of electricity (electricity) |
Kg CO2/kWh |
0.3 |
|
|
Average new car fuel consumption (petrol) |
litres/100km |
5.6 |
|
|
Average new car fuel consumption (diesel) |
litres/100km |
4.9 |
|
|
Average electric car consumption |
kWh/100km |
20.0 |
|
|
Non-traded price of carbon (2019) |
£/tCO2e |
67.0 |
Low-carbon infrastructure scenario
The low-carbon infrastructure scenario estimates the potential benefits of increasing the climate ambitions of new developments, based on the energy reduction achievements of low-carbon developments in the 2004 London Plan. We calculate the savings per major development under the London Plan, and extend the benefits to all major developments in the UK, using England’s definition of a major development. We assume that the proportion of planning applications that satisfy the English definition of ‘major’ is equivalent in Scotland and Northern Ireland, which use a different definition of major development. We estimate a lower-bound value under the assumption that all carbon saved is tradable, and an upper-bound value under the assumption that none of the carbon saved is tradable. Assumptions and data sources for these calculations are laid out in the table below.
|
Parameter |
Unit |
Value |
Source |
|
Number of low-carbon developments |
# |
113 |
The use of planning to encourage low carbon energy technologies in buildings |
|
Reduction in CO2 per development per year |
tonnes |
1,200 |
The use of planning to encourage low carbon energy technologies in buildings |
|
Non-traded price of carbon (2019) |
£/tCO2e |
67 |
|
|
Traded price of carbon (2019) |
£/tCO2e |
13 |
|
|
Number of minor developments granted in England (year ending 31/12/2019) |
# |
88,004 |
|
|
Number of major developments granted in England (year ending 31/12/2019) |
# |
11,195 |
|
|
Major developments as a proportion of total developments granted planning permission |
% |
11% |
Calculation |
|
Planning applications approved in Scotland in 2018/19 |
# |
25,649 |
|
|
Number of major applications in Wales (2018/19) |
# |
481 |
|
|
Planning applications approved in Northern Ireland in 2018/19 |
# |
11,329 |
|
|
Approval rate for residential developments in Wales (2018/19) |
% |
91% |
Greenspace ambition scenario
Vivid Economics has developed a toolkit which calculates location-specific economic values of the health, social and environmental benefits of urban green infrastructure – the proprietary tool Greenkeeper. Greenkeeper uses big data and leading academic research to estimate visits to urban greenspaces and the benefits provided in terms of health, wellbeing, local value and carbon sequestration. It quantifies these benefits in monetary terms for any urban greenspace in the UK, standardising and making evidence accessible to decision-makers in the public and private sector.
To illustrate the potential benefits of greenspace planning through strategic placement and quality improvements for new greenspace provision, four scenarios of greenspace provision in Blackpool were modelled using the Greenkeeper tool. The modelling results are displayed in Table 4.
- Scenario 1 (Poor planning): A greenspace is added to the area in a location that does not ensure good access for residents and no facilities are added to the park
- Scenario 2: A greenspace is added to the area in a location that ensures good access for residents but no facilities are added to the park
- Scenario 3: A greenspace is added to the area in a location that does not ensure good access for residents but key facilities are added to the park
- Scenario 4 (Good planning): A greenspace is added to the area in a location that ensures good access for residents and key facilities are added to the park
Table 4: Results of strategic placement and quality improvement scenarios from Greenkeeper
|
Scenario |
Predicted annual visits (thousands) |
Annual mental wellbeing benefits (thousands) |
Annual physical health benefits (thousands) |
|
Scenario 1 |
6 |
81 |
46 |
|
Scenario 2 |
12 |
148 |
84 |
|
Scenario 3 |
62 |
794 |
451 |
|
Scenario 4 |
107 |
1,366 |
776 |
Source: Vivid Economics Greenkeeper Tool
Figure 6: Blackpool deprived, low-access areas and potential green space locations
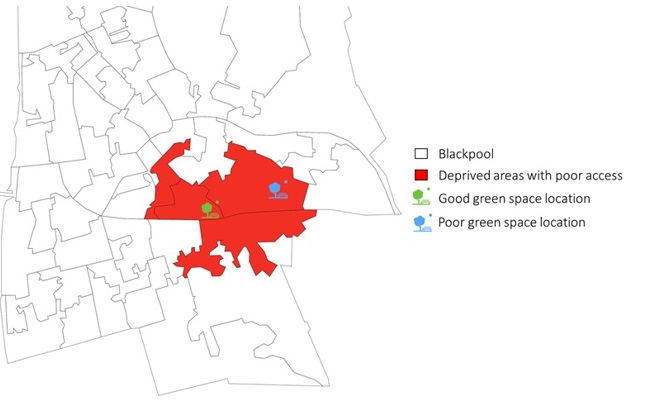
Source: Vivid Economics
Figure 7: Annual health benefits under different location and quality specifications for a greenspace in Blackpool
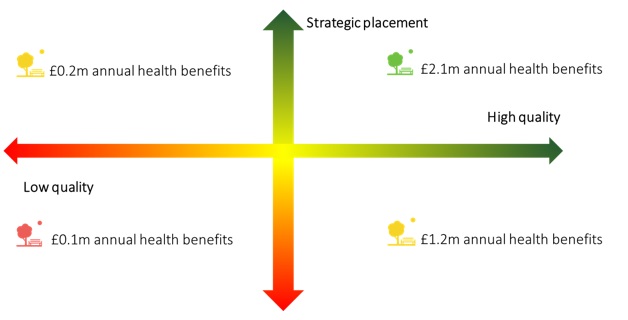
Source: Vivid Economics
References
Agyepong-Parsons, James. “Capacity Crunch: Do Councils Have the Expertise to Deliver Their Biodiversity Goals?,” n.d. https://www.endsreport.com/article/1585763/capacity-crunch-councils-expertise-deliver-biodiversity-goals.
Ahlfeldt, Gabriel M., and Elisabetta Pietrostefani. “The Economic Effects of Density: A Synthesis.” Journal of Urban Economics 111, no. February (2019): 93–107. https://doi.org/10.1016/j.jue.2019.04.006.
Airey, Jack, and Chris Doughty. “Rethinking the Planning System for the 21st Century,” 2020.
Arbon, Joanne, and Iarla Kilbane-dawe. “Manual B - Minimising Air Pollution from New Developments,” 2013.
Auditor General for Wales. “The Effectiveness of Local Planning Authorities in Wales,” 2019.
Barker, Anna, David Churchill, and Adam Crawford. “Leeds Parks Survey: Findings in Numbers,” no. March (2018). https://futureofparks.leeds.ac.uk/wp-content/uploads/sites/26/2018/03/Leeds-Parks-Survey-Findings-in-Numbers.pdf.
Barker, Nathaniel. “Northern Ireland Misses Annual Social Housing Build Target by More than Half as Pandemic Bites,” 2020. https://www.insidehousing.co.uk/news/news/northern-ireland-misses-annual-social-housing-build-target-by-more-than-half-as-pandemic-bites-66691.
———. “Welsh Government Pumps Extra £24m into Affordable Housing as Building Target Deadline Looms,” 2020. https://www.insidehousing.co.uk/news/news/welsh-government-pumps-extra-24m-into-affordable-housing-as-building-target-deadline-looms-65100#:~:text=Welsh ministers have set a,runs from 2016 to 2021.&text=This figure will need to,the target to be reached.
Benzeval, Michaela, Lyndal Bond, Mhairi Campbell, Matthew Egan, Theo Lorenc, Mark Petticrew, and Frank Popham. “How Does Money Influence Health?” Joseph Rowntree Foundation, no. March 2014 (2014).
Cave, Suzie, Alan Rehfisch, Louise Smith, and Graham Winter. “Comparison of the Planning Systems in the Four UK Countries,” 2016. http://www.niassembly.gov.uk/globalassets/documents/raise/publications/2013/environment/8213.pdf.
Chen, Fei, Carol Ludwig, and Olivier Sykes. “Heritage Conservation through Planning: A Comparison of Policies and Principles in England and China.” Planning Practice and Research 00, no. 00 (2020): 1–24. https://doi.org/10.1080/02697459.2020.1752472.
Cheshire West and Chester. “Local Plan (Part One) Strategic Policies,” 2015.
Clarence Valley Cultural and Community Facilities Plan. “The Importance of Cultural and Community Infrastructure,” n.d. http://www.sciencedirect.com/science/article/pii/S0047272706000569.
Clifford, Ben, Patricia Canelas, Jessica Ferm, and Nicola Livingstone. “Assessing the Impacts of Extending Permitted Development Rights to Office-to-Residential Change of Use in England.” Royal Institution of Chartered Surveyors, 2018.
Clifford, Ben, Patricia Canelas, Jessica Ferm, Nicola Livingstone, Alex Lord, and Richard Dunning. “Research into the Quality Standard of Homes Delivered through Change of Use Permitted Development Rights,” 2020. http://forms.communities.gov.uk/or.
———. “Research into the Quality Standard of Homes Delivered through Change of Use Permitted Development Rights,” 2020.
COMEAP. “Associations of Long-Term Average Concentrations of Nitrogen Dioxide with Mortality - A Report by the Committee on the Medical Effects of Air Pollutants,” 2018. https://assets.publishing.service.gov.uk/government/uploads/system/uploads/attachment_data/file/734799/COMEAP_NO2_Report.pdf.
Day, A. R., P. Ogumka, P. G. Jones, and A. Dunsdon. “The Use of the Planning System to Encourage Low Carbon Energy Technologies in Buildings.” Renewable Energy 34, no. 9 (2009): 2016–21. https://doi.org/10.1016/j.renene.2009.02.003.
Department for Business Energy & Industrial Strategy. “2018 UK Greenhouse Gas Emissions, Provisional Figures,” 2019.
Department for Communities and Local Government. “Evidence Review of the Costs of Homelessness,” 2012. https://www.gov.uk/government/uploads/system/uploads/attachment_data/file/7596/2200485.pdf.
Department for Communities and Local Government (UK). “The DCLG Appraisal Guide,” 2016.
Department for Transport. “Mode of Travel,” 2020. https://www.gov.uk/government/statistical-data-sets/nts03-modal-comparisons.
———. “Walking and Cycling Statistics,” 2020. https://www.gov.uk/government/collections/walking-and-cycling-statistics.
Ding, Ding, Kenny D Lawson, Tracy L Kolbe-Alexander, Eric A Finkelstein, Peter T Katzmarzyk, Willem van Mechelen, and Michael Pratt. “The Economic Burden of Physical Inactivity: A Global Analysis of Major Non-Communicable Diseases.” The Lancet 388, no. 10051 (September 2016): 1311–24. https://doi.org/10.1016/S0140-6736(16)30383-X.
Engemann, Kristine, Carsten Bøcker Pedersen, Lars Arge, Constantinos Tsirogiannis, Preben Bo Mortensen, and Jens-Christian Svenning. “Residential Green Space in Childhood Is Associated with Lower Risk of Psychiatric Disorders from Adolescence into Adulthood.” Proceedings of the National Academy of Sciences 116, no. 11 (March 12, 2019): 5188–93. https://doi.org/10.1073/pnas.1807504116.
Environmental Protection UK and The Institute of Air Quality Management. “Land-Use Planning & Development Control: Planning For Air Quality,” 2017.
Flies, Emily J, Chris Skelly, Sagri Singh Negi, Poornima Prabhakaran, Qiyong Liu, Keke Liu, Fiona C Goldizen, Chris Lease, and Philip Weinstein. “Biodiverse Green Spaces: A Prescription for Global Urban Health.” Frontiers in Ecology and the Environment 15, no. 9 (November 2017): 510–16. https://doi.org/10.1002/fee.1630.
Frontier Economics Limited. “Assessing the Social and Economic Impact of Affordable Housing Investment,” no. September (2014): 1–103.
Garton Grinwood, Gabrielle, Nikki Sutherland, and Marie Morris. “Housebuilding Targets.” Debate Pack, 2019.
Gemmell, Campbell. “Cleaner Air for Scotland Strategy: Independent Review,” 2019. https://www.gov.scot/publications/cleaner-air-scotland-strategy-independent-review/pages/4/.
Goodman, Anna, Shannon Sahlqvist, and David Ogilvie. “New Walking and Cycling Routes and Increased Physical Activity: One- and 2-Year Findings from the UK IConnect Study.” American Journal of Public Health 104, no. 9 (2014): 38–46. https://doi.org/10.2105/AJPH.2014.302059.
Gray, Selena, and Alan Kellas. “Covid-19 Has Highlighted the Inadequate, and Unequal, Access to High Quality Green Spaces,” 2020. https://blogs.bmj.com/bmj/2020/07/03/covid-19-has-highlighted-the-inadequate-and-unequal-access-to-high-quality-green-spaces/.
Greater London Authority. “Energy Planning Guideline,” n.d. https://www.london.gov.uk/what-we-do/planning/planning-applications-and-decisions/pre-planning-application-meeting-service-0.
———. “London Plan Overview and Introduction,” n.d. https://www.london.gov.uk/what-we-do/planning/london-plan/current-london-plan/london-plan-overview-and-introduction.
———. “Sustainable Design and Construction,” n.d. https://www.london.gov.uk/what-we-do/planning/implementing-london-plan/planning-guidance/sustainable-design-and.
Harker, Lisa. “Chance of a Lifetime: The Impact of Bad Housing on Children’s Lives,” 2006, 40. https://england.shelter.org.uk/__data/assets/pdf_file/0016/39202/Chance_of_a_Lifetime.pdf.
Hastings, Annette, Nick Bailey, Glen Bramley, Maria Gannon, and David Watkins. “The Cost of the Cuts: The Impact on Local Government and Poorer Comunities.” Joseph Rowntree Foundation Report, no. March (2015): 5–127.
Heads of Planning Scotland. “Action Report from Heads of Planning Scotland on the Recent CIPFA/HOPE Survey on Costing the Planning Service in Scotland,” no. February (2019).
Historic England. “Heritage and The Economy 2019.” Rethinking Historical Time, 2019. https://doi.org/10.5040/9781350065116.ch-009.
———. “Historic England,” n.d. https://historicengland.org.uk/.
HM Government. “Industrial Strategy: Building a Britain Fit for the Future,” 2017. https://doi.org/10.1108/01443589410070806.
Hughes, Owen. “NHS Digitisation Expected to Cost up to £13bn – Report,” 2018.
Kyu, Hmwe H, Victoria F Bachman, Lily T Alexander, John Everett Mumford, Ashkan Afshin, Kara Estep, J Lennert Veerman, et al. “Physical Activity and Risk of Breast Cancer, Colon Cancer, Diabetes, Ischemic Heart Disease, and Ischemic Stroke Events: Systematic Review and Dose-Response Meta-Analysis for the Global Burden of Disease Study 2013.” BMJ, August 9, 2016, i3857. https://doi.org/10.1136/bmj.i3857.
Lord, Alex, Richard Dunning, Bertie Dockerill, Gemma Burgess, Adrian Carro, Tony Crook, Craig Watkins, and Christine Whitehead. “The Incidence, Value and Delivery of Planning Obligations and Community Infrastructure Levy in England in 2018-19,” 2020. http://www.nationalarchives.gov.uk/doc/open-government-licence/version/3/.
———. “The Incidence, Value and Delivery of Planning Obligations and Community Infrastructure Levy in England in 2018-19,” 2020.
Maxwell, Sean L., Richard A. Fuller, Thomas M. Brooks, and James E. M. Watson. “Biodiversity: The Ravages of Guns, Nets and Bulldozers.” Nature 536, no. 7615 (August 10, 2016): 143–45. https://doi.org/10.1038/536143a.
Ministry of Housing Communities and Local Government. “Community Infrastructure Levy,” 2014. https://www.gov.uk/guidance/community-infrastructure-levy.
———. “English Housing Survey,” 2016. https://doi.org/10.1017/CBO9781107415324.004.
———. “Live Tables on Housing Supply: Net Additional Dwellings,” 2019. https://www.gov.uk/government/statistical-data-sets/live-tables-on-net-supply-of-housing.
———. “National Planning Policy Framework,” 2019.
———. “Neighbourhood Planning,” n.d. https://www.gov.uk/guidance/neighbourhood-planning--2#:~:text=A Neighbourhood Development Order can,Neighbourhood Development Order can therefore:&text=grant planning permission for a,outright or subject to conditions.
———. “Planning For The Future: White Paper August 2020,” 2020.
———. “Planning Obligations,” n.d. https://www.gov.uk/guidance/planning-obligations.
———. “Units Granted Planning Permission on All Sites, England,” n.d. https://opendatacommunities.org/resource?uri=http://opendatacommunities.org/data/planning/units-granted-permission/all-sites.
Nathaniel Lichfield & Partners. “Invest to Grow How Can Planning Support Inward,” 2016.
National Audit Office. “Planning for New Homes,” 2019. https://www.nao.org.uk/wp-content/uploads/2019/02/Planning-for-new-homes.pdf.
———. “Planning for New Homes,” 2019.
———. “The Impact of Funding Reductions on Local Authorities.” Local Government Report, 2014.
National Housing Federation. “Capital Grant Required to Meet Social Housing Need in England 2021 – 2031,” no. 302132 (2019): 1–25.
Natural England. “An Estimate of the Economic and Health Value and Cost Effectiveness of the Expanded WHI Scheme 2009. TIN055.” 864, no. July (2009): 1–11.
———. “Green Space Access, Green Space Use, Physical Activity and Overweight,” 2011. http://publications.naturalengland.org.uk/file/80007.
NI Direct. “Making a Planning Decision,” n.d. https://www.nidirect.gov.uk/articles/making-planning-decision#:~:text=The council should make a,to the Planning Appeals Commission.
Northern Ireland Co-Ownership Housing Association Limited. “Submission to Belfast City Council’s Consultation on the Belfast Local Development Plan – Draft Plan Strategy 2035,” 2018.
Northern Ireland Department of The Environment. “Strategic Planning Policy Statement for Northern Ireland,” 2015.
Office for National Statistics. “Comparing Affordable Housing in the UK: April 2008 to March 2018,” 2019. https://www.ons.gov.uk/peoplepopulationandcommunity/housing/articles/comparingaffordablehousingintheuk/april2008tomarch2018.
———. “Population Estimates for the UK, England and Wales, Scotland and Northern Ireland: Mid-2018,” 2019. https://www.ons.gov.uk/peoplepopulationandcommunity/populationandmigration/populationestimates/bulletins/annualmidyearpopulationestimates/mid2018/previous/v1#local-population-change.
———. “Rural Population and Migration,” 2020, 1–23.
———. “Town Planning Officers and Other Occupations by Ethnicity, Age, Sex, Employed or Self-Employed Status and Public or Private Sector Working, UK, October 2004 to September 2018,” 2019. https://www.ons.gov.uk/employmentandlabourmarket/peopleinwork/employmentandemployeetypes/adhocs/009779townplanningofficersandotheroccupationsbyethnicityagesexemployedorselfemployedstatusandpublicorprivatesectorworkingukoctober2004toseptember2018.
Oxford Economics. “The Impact of Heritage Tourism for the UK Economy,” 2016.
Phibbs, Peter. “Literature Review into the Benefits of Investment in Human and Cultural Infrastructure and Services,” no. January (2016).
Planning Aid Wales. “Place Plans,” n.d. http://www.placeplans.org.uk/en/?page_id=315.
Pomeroy, Steve, and Maude Marquis-Bissonnette. “Non-Housing Outcomes of Affordable Housing,” 2016. www.cmhc.ca.
Public Health England. “Improving Access to Greenspace: A New Review for 2020,” 2020. https://assets.publishing.service.gov.uk/government/uploads/system/uploads/attachment_data/file/904439/Improving_access_to_greenspace_2020_review.pdf.
———. “PHE Strategy 2020-25,” no. GW-694 (2019): 1–40. https://assets.publishing.service.gov.uk/government/uploads/system/uploads/attachment_data/file/831562/PHE_Strategy_2020-25.pdf.
———. “Physical Activity: Applying All Our Health,” 2019. https://www.gov.uk/government/publications/physical-activity-applying-all-our-health/physical-activity-applying-all-our-health#:~:text=Physical inactivity is responsible for,billion to the NHS alone).
———. “Spatial Planning for Health: An Evidence Resource for Planning and Designing Healthier Places About Public Health England,” 2017.
Public Health Wales. “Long Term Strategy 2018-30: Working to Achieve a Healthier Future for Wales,” 2018.
Reid, Carlton. “U.K. Government Boosts Bicycling And Walking With Ambitious £2 Billion Post-Pandemic Plan,” 2020. https://www.forbes.com/sites/carltonreid/2020/05/09/uk-government-boosts-bicycling-and-walking-with-ambitious-2-billion-post-pandemic-plan/#2746fadc3d7c.
Sallis, James F., Ester Cerin, Terry L. Conway, Marc A. Adams, Lawrence D. Frank, Michael Pratt, Deborah Salvo, et al. “Physical Activity in Relation to Urban Environments in 14 Cities Worldwide: A Cross-Sectional Study.” The Lancet 387, no. 10034 (2016): 2207–17. https://doi.org/10.1016/S0140-6736(15)01284-2.
Scottish Government. “Local Housing Strategy: Guidance 2019,” 2019. https://www.gov.scot/publications/local-housing-strategy-guidance-2019/pages/15/#:~:text=Affordable Housing Supply Programme - the,will be for social rent.
Shelter. “Homelessness Crisis Costs Councils over £1bn in Just One Year,” 2019. https://england.shelter.org.uk/media/press_releases/articles/homelessness_crisis_costs_councils_over_1bn_in_just_one_year.
Shiel, Liz, and James Battye. “Planning to Meet the Need : Delivering Affordable Housing through the Planning System in Scotland,” 2014.
———. “Planning to Meet the Need: Delivering Affordable Housing through the Planning System in Scotland,” 2014.
Solmi, Francesca, Mariya Melnychuk, and Stephen Morris. “The Cost of Mental and Physical Health Disability in Childhood and Adolescence to Families in the UK: Findings from a Repeated Cross-Sectional Survey Using Propensity Score Matching.” BMJ Open 8, no. 2 (2018): 1–10. https://doi.org/10.1136/bmjopen-2017-018729.
South Tyneside Council. “International Advanced Manufacturing Park,” n.d. https://www.southtyneside.gov.uk/article/33946/International-Advanced-Manufacturing-Park.
———. “International Advanced Manufacturing Park,” n.d.
Southon, Georgina E., Anna Jorgensen, Nigel Dunnett, Helen Hoyle, and Karl L. Evans. “Biodiverse Perennial Meadows Have Aesthetic Value and Increase Residents’ Perceptions of Site Quality in Urban Green-Space.” Landscape and Urban Planning 158 (February 2017): 105–18. https://doi.org/10.1016/j.landurbplan.2016.08.003.
StatsWales. “Additional Affordable Housing Provision by Location, Year and Funding,” n.d. https://statswales.gov.wales/Catalogue/Housing/Affordable-Housing/Provision/additionalaffordablehousingprovision-by-location-year-funding.
Sustrans. “Covid-19 Temporary Cycling and Walking Interventions,” n.d. https://www.sustrans.org.uk/for-professionals/infrastructure/walking-and-cycling-infrastructure-design-guidance/covid-19-temporary-cycling-and-walking-interventions.
The Royal Town Planning Institute. “Biodiversity in Planning,” no. November (2019).
———. “Plan The World We Need: The Contribution of Planning to a Sustainable, Resilient and Inclusive Recovery,” 2020.
———. “Resourcing Public Planning,” 2019.
———. “Settlement Patterns, Urban Form & Sustainability - An Evidence Review,” 2018.
The Royal Town Planning Institute Scotland. “Progressing Performance: Investing in Scotland’s Planning Service,” 2015.
———. “Resourcing the Planning System: Key Trends and Findings 2019,” 2019.
The Scottish Government. “Affordable Housing Investment Programme 2009-10 Out-Turn Report,” no. October (2009).
———. “Affordable Housing Supply Programme Out-Turn Report 2018-19,” 2020.
———. “Community Planning,” n.d. https://www.gov.scot/policies/improving-public-services/community-planning/.
———. “Monitoring the Outcomes of Planning: A Research Study,” no. August (2018).
———. “Planning Application Decision Times Published,” 2019. https://www.gov.scot/news/planning-application-decision-times-published-4/.
———. “Planning Circular 3/2013: Development Management Procedures,” 2019. https://www.gov.scot/publications/planning-series-circular-3-2013-development-management-procedures/pages/7/.
———. Scotland’s Third National Planning Framework, 2014. https://www.gov.scot/publications/national-planning-framework-3/.
———. Scottish Planning Policy, 2014.
Thomas, Matthew A. “On The Benefits of Affordable Housing,” 2017.
UK Department for Business Energy & Industrial Strategy. “2019 UK Greenhouse Gas Emissions, Provisional Figures.” National Statistics, 2020. https://assets.publishing.service.gov.uk/government/uploads/system/uploads/attachment_data/file/790626/2018-provisional-emissions-statistics-report.pdf.
UK Government. “UK Becomes First Major Economy to Pass Net Zero Emissions Law,” 2019.
UK Government Digital Service. “Digital Efficiency Report,” 2012.
UK Parliament. Town and Country Planning Act (1990). https://www.legislation.gov.uk/ukpga/1990/8/section/106.
UNESCO. “United Kingdom of Great Britain and Nothern Ireland,” n.d. https://whc.unesco.org/en/statesparties/gb.
Vivid Economics and Barton Willmore. “Levelling Up and Building Back Better Through Urban Green Infrastructure: An Investment Options Appraisal,” 2020.
Welsh Government. All Wales Planning Annual Performance Report 2017-18, 2018.
———. “Appeal a Planning Decision,” 2019. https://gov.wales/appeal-planning-decision.
———. “National Development Framework 2020-2040,” 2020.
———. “Planning Policy Wales,” 2018.
West Yorkshire Local Authorities. “West Yorkshire Low Emissions Strategy 2016 to 2021,” 2016.
White, M.P., L.R. Elliott, T. Taylor, B.W. Wheeler, A. Spencer, A. Bone, M.H. Depledge, and L.E. Fleming. “Recreational Physical Activity in Natural Environments and Implications for Health: A Population Based Cross-Sectional Study in England.” Preventive Medicine 91 (October 2016): 383–88. https://doi.org/10.1016/j.ypmed.2016.08.023.
WHO. “Physical Activity Fact Sheet,” 2018. https://www.who.int/news-room/fact-sheets/detail/physical-activity.
Wilson, Wendy, and Cassie Barton. “Tackling the Under-Supply of Housing in England.” House of Commons Library, no. 07671 (2020): 80. https://researchbriefings.parliament.uk/ResearchBriefing/Summary/CBP-7671#fullreport.
World Health Organization. “Global Recommendations on Physical Activity for Health,” 2010.
———. “Health Risks Related to Overcrowding,” n.d. https://www.who.int/water_sanitation_health/emergencies/qa/emergencies_qa9/en/#:~:text=For communities, inadequate shelter and,the population density is high.
World Health Organization, and Secretariat of the Convention on Biological Diversity. Connecting Global Priorities: Biodiversity and Human Health. Geneva: WHO Library, 2015.
[1] References to the NHS are used as an umbrella term for the UK publicly-funded healthcare systems, incorporated the NHS in England, NHS Scotland, NHS Wales and Health and Social Care in Northern Ireland
[2] Hastings et al., “The Cost of the Cuts: The Impact on Local Government and Poorer Comunities.”
[3] The Royal Town Planning Institute Scotland, “Resourcing the Planning System: Key Trends and Findings 2019”; Auditor General for Wales, “The Effectiveness of Local Planning Authorities in Wales.”
[4] Airey and Doughty, “Rethinking the Planning System for the 21st Century.”
[5] Airey and Doughty.
[6] Office for National Statistics, “Population Estimates for the UK, England and Wales, Scotland and Northern Ireland: Mid-2018.”
[7] Office for National Statistics, “Rural Population and Migration.”
[8] We note that although this has been published by the UK’s Ministry of Housing, Communities and Local Government, the proposed reforms are only applicable in most part to England.
[9] Ministry of Housing Communities and Local Government, “Planning For The Future: White Paper August 2020.”
[10] Gray and Kellas, “Covid-19 Has Highlighted the Inadequate, and Unequal, Access to High Quality Green Spaces.”
[11] Cave et al., “Comparison of the Planning Systems in the Four UK Countries.”
[12] The terminology in England is “local plan”, while it is referred to as a “local development plan” in Wales, Scotland and Northern Ireland. For simplicity, this report refers only to local development plans (except when making specific reference to an English local plan), which should be interpreted as inclusive of English local plans.
[13] Ministry of Housing Communities and Local Government, “Planning Obligations.”
[14] Lord et al., “The Incidence, Value and Delivery of Planning Obligations and Community Infrastructure Levy in England in 2018-19,” 2020.
[15] Cave et al., “Comparison of the Planning Systems in the Four UK Countries.”
[16] Clifford et al., “Assessing the Impacts of Extending Permitted Development Rights to Office-to-Residential Change of Use in England.”
[17] UK Parliament, Town and Country Planning Act.
[18] Cave et al., “Comparison of the Planning Systems in the Four UK Countries.”
[19] Northern Ireland Co-Ownership Housing Association Limited, “Submission to Belfast City Council’s Consultation on the Belfast Local Development Plan – Draft Plan Strategy 2035.”
[20] Ministry of Housing Communities and Local Government, “Community Infrastructure Levy.”
[21] Lord et al., “The Incidence, Value and Delivery of Planning Obligations and Community Infrastructure Levy in England in 2018-19,” 2020.
[22] Ministry of Housing Communities and Local Government, “National Planning Policy Framework.”
[23] Welsh Government, “Planning Policy Wales.”
[24] Welsh Government, “National Development Framework 2020-2040.”
[25] The Scottish Government, Scottish Planning Policy.
[26] The Scottish Government, Scotland’s Third National Planning Framework.
[27] Northern Ireland Department of The Environment, “Strategic Planning Policy Statement for Northern Ireland.”
[28] HM Government, “Industrial Strategy: Building a Britain Fit for the Future.”
[29] UK Government, “UK Becomes First Major Economy to Pass Net Zero Emissions Law.”
[30] Department for Business Energy & Industrial Strategy, “2018 UK Greenhouse Gas Emissions, Provisional Figures.”
[31] Wilson and Barton, “Tackling the Under-Supply of Housing in England.”
[32] Barker, “Welsh Government Pumps Extra £24m into Affordable Housing as Building Target Deadline Looms”; Scottish Government, “Local Housing Strategy: Guidance 2019.”
[33] Barker, “Northern Ireland Misses Annual Social Housing Build Target by More than Half as Pandemic Bites.”
[34] Public Health England, “PHE Strategy 2020-25”; Public Health Wales, “Long Term Strategy 2018-30: Working to Achieve a Healthier Future for Wales.”
[35] Engemann et al., “Residential Green Space in Childhood Is Associated with Lower Risk of Psychiatric Disorders from Adolescence into Adulthood.”
[36] The Royal Town Planning Institute Scotland, “Resourcing the Planning System: Key Trends and Findings 2019”; Auditor General for Wales, “The Effectiveness of Local Planning Authorities in Wales.”
[37] Agyepong-Parsons, “Capacity Crunch: Do Councils Have the Expertise to Deliver Their Biodiversity Goals?”
[38] Office for National Statistics, “Town Planning Officers and Other Occupations by Ethnicity, Age, Sex, Employed or Self-Employed Status and Public or Private Sector Working, UK, October 2004 to September 2018.”
[39] The Royal Town Planning Institute, “Resourcing Public Planning.”
[40] The Royal Town Planning Institute.
[41] National Audit Office, “Planning for New Homes,” 2019; The Royal Town Planning Institute Scotland, “Progressing Performance: Investing in Scotland’s Planning Service.”
[42] The Royal Town Planning Institute, “Resourcing Public Planning.”
[43] The Royal Town Planning Institute.
[44] The Scottish Government, “Monitoring the Outcomes of Planning: A Research Study.”
[45] The Scottish Government, “Planning Circular 3/2013: Development Management Procedures.”
[46] Auditor General for Wales, “The Effectiveness of Local Planning Authorities in Wales.”
[47] 16 weeks for developments requiring an Environmental Impact Assessment
[48] Ministry of Housing Communities and Local Government, “Community Infrastructure Levy”; Welsh Government, “Appeal a Planning Decision”; NI Direct, “Making a Planning Decision.”
[49] National Audit Office, “Planning for New Homes,” 2019.
[50] The Scottish Government, “Planning Application Decision Times Published.”
[51] Auditor General for Wales, “The Effectiveness of Local Planning Authorities in Wales.”
[52] Ministry of Housing Communities and Local Government, “Units Granted Planning Permission on All Sites, England”; Ministry of Housing Communities and Local Government, “Live Tables on Housing Supply: Net Additional Dwellings.”
[53] Welsh Government, All Wales Planning Annual Performance Report 2017-18; StatsWales, “Additional Affordable Housing Provision by Location, Year and Funding.”
[54] The NPPF states that “at least 10% of the homes to be available for affordable home ownership, unless this would exceed the level of affordable housing required in the area, or significantly prejudice the ability to meet the identified affordable housing needs of specific groups.” Since affordable home ownership is only one form of affordable housing, there is no minimal requirement set for affordable homes in the broader sense.
[55] Ministry of Housing Communities and Local Government, “National Planning Policy Framework.”
[56] Garton Grinwood, Sutherland, and Morris, “Housebuilding Targets.”
[57] This decline may be partially attributed to the combination of provisions for affordable units supplied through developer contributions and also as a result of the ‘Right to Buy’ scheme introduced in the UK in in 1980, which allows council housing tenants to purchase units from Local Authorities at a discount.
[58] The Scottish Government, “Affordable Housing Supply Programme Out-Turn Report 2018-19”; The Scottish Government, “Affordable Housing Investment Programme 2009-10 Out-Turn Report”; Shiel and Battye, “Planning to Meet the Need: Delivering Affordable Housing through the Planning System in Scotland.”
[59] National Housing Federation, “Capital Grant Required to Meet Social Housing Need in England 2021 – 2031.”
[60] Thomas, “On The Benefits of Affordable Housing.”
[62] Frontier Economics Limited, “Assessing the Social and Economic Impact of Affordable Housing Investment”; Thomas, “On The Benefits of Affordable Housing.”
[64] Shelter, “Homelessness Crisis Costs Councils over £1bn in Just One Year.”
[65] (as per Shiel & Battye, 2014)
[66] 15% of private sector homes in England present a risk to a person’s health and safety, while only 6% of affordable housing units do Ministry of Housing Communities and Local Government, “English Housing Survey”; Office for National Statistics, “Comparing Affordable Housing in the UK: April 2008 to March 2018.”. In Northern Ireland only 4.4% of all affordable housing units are present a health risk, while in Scotland all affordable housing units are above the tolerable standard Office for National Statistics.
[67] Clifford et al., “Research into the Quality Standard of Homes Delivered through Change of Use Permitted Development Rights,” 2020.
[69] Pomeroy and Marquis-Bissonnette, “Non-Housing Outcomes of Affordable Housing.”
[70] World Health Organization, “Health Risks Related to Overcrowding.”
[71] England £14.6 million; Scotland £3.5 million; Wales £660,000
[72] Department for Communities and Local Government (UK), “The DCLG Appraisal Guide.”
[73] Department for Communities and Local Government, “Evidence Review of the Costs of Homelessness.”
[74] Thomas, “On The Benefits of Affordable Housing.”
[75] Harker, “Chance of a Lifetime: The Impact of Bad Housing on Children’s Lives.”
[76] Solmi, Melnychuk, and Morris, “The Cost of Mental and Physical Health Disability in Childhood and Adolescence to Families in the UK: Findings from a Repeated Cross-Sectional Survey Using Propensity Score Matching.”
[77] Benefits of reduced traffic congestion are discussed further in the section on integrated settlements
[78] Sallis et al., “Physical Activity in Relation to Urban Environments in 14 Cities Worldwide: A Cross-Sectional Study.”
[79] Public Health England, “Physical Activity: Applying All Our Health.”
[80] Department for Transport, “Walking and Cycling Statistics.”
[81] Public Health England, “Spatial Planning for Health: An Evidence Resource for Planning and Designing Healthier Places About Public Health England.”
[82] World Health Organization, “Global Recommendations on Physical Activity for Health.”
[83] UK Department for Business Energy & Industrial Strategy, “2019 UK Greenhouse Gas Emissions, Provisional Figures.”
[84] Department for Transport, “Mode of Travel.”
[85] Goodman, Sahlqvist, and Ogilvie, “New Walking and Cycling Routes and Increased Physical Activity: One- and 2-Year Findings from the UK IConnect Study.”
[86] Ministry of Housing Communities and Local Government, “National Planning Policy Framework”; Welsh Government, “Planning Policy Wales”; The Scottish Government, Scottish Planning Policy.
[87] Airey and Doughty, “Rethinking the Planning System for the 21st Century.”
[88] Welsh Government, “Planning Policy Wales.”
[89] Lord et al., “The Incidence, Value and Delivery of Planning Obligations and Community Infrastructure Levy in England in 2018-19,” 2020.
[90] Clarence Valley Cultural and Community Facilities Plan, “The Importance of Cultural and Community Infrastructure.”
[91] Phibbs, “Literature Review into the Benefits of Investment in Human and Cultural Infrastructure and Services.”
[92] Lord et al., “The Incidence, Value and Delivery of Planning Obligations and Community Infrastructure Levy in England in 2018-19,” 2020.
[93] White et al., “Recreational Physical Activity in Natural Environments and Implications for Health: A Population Based Cross-Sectional Study in England”; Natural England, “Green Space Access, Green Space Use, Physical Activity and Overweight.”
[94] Ding et al., “The Economic Burden of Physical Inactivity: A Global Analysis of Major Non-Communicable Diseases”; WHO, “Physical Activity Fact Sheet”; Kyu et al., “Physical Activity and Risk of Breast Cancer, Colon Cancer, Diabetes, Ischemic Heart Disease, and Ischemic Stroke Events: Systematic Review and Dose-Response Meta-Analysis for the Global Burden of Disease Study 2013.”
[95] Engemann et al., “Residential Green Space in Childhood Is Associated with Lower Risk of Psychiatric Disorders from Adolescence into Adulthood.”
[96] Benzeval et al., “How Does Money Influence Health?”; Public Health England, “Improving Access to Greenspace: A New Review for 2020.”
[97] Maxwell et al., “Biodiversity: The Ravages of Guns, Nets and Bulldozers.”
[98] Along with legislative requirements through the Wildlife and Countryside Act and the Habitats and Species Regulations
[99] The Royal Town Planning Institute, “Biodiversity in Planning.”
[100] Welsh Government, “Planning Policy Wales.”
[101] Southon et al., “Biodiverse Perennial Meadows Have Aesthetic Value and Increase Residents’ Perceptions of Site Quality in Urban Green-Space.”
[102] (WHO and SCBD 2015)
[103] Flies et al., “Biodiverse Green Spaces: A Prescription for Global Urban Health.”
[104] UNESCO, “United Kingdom of Great Britain and Nothern Ireland”; Historic England, “Historic England.”
[105] Historic England, “Heritage and The Economy 2019.”
[106] Cheshire West and Chester, “Local Plan (Part One) Strategic Policies.”
[107] Chen, Ludwig, and Sykes, “Heritage Conservation through Planning: A Comparison of Policies and Principles in England and China.”
[108] Historic England, “Heritage and The Economy 2019”; Oxford Economics, “The Impact of Heritage Tourism for the UK Economy.”
[109] Ministry of Housing Communities and Local Government, “National Planning Policy Framework.”
[110] Welsh Government, “Planning Policy Wales.”
[111] The Scottish Government, Scottish Planning Policy; Northern Ireland Department of The Environment, “Strategic Planning Policy Statement for Northern Ireland.”
[112] The Royal Town Planning Institute, “Settlement Patterns, Urban Form & Sustainability - An Evidence Review.”
[113] Ahlfeldt and Pietrostefani, “The Economic Effects of Density: A Synthesis.”
[114] South Tyneside Council, “International Advanced Manufacturing Park,” n.d.
[115] South Tyneside Council, “International Advanced Manufacturing Park,” n.d.
[116] Nathaniel Lichfield & Partners, “Invest to Grow How Can Planning Support Inward.”
[117] Welsh Government, “Planning Policy Wales.”
[118] The Scottish Government, Scotland’s Third National Planning Framework.
[119] Ministry of Housing Communities and Local Government, “National Planning Policy Framework.”
[120] (Northern Ireland Department of The Environment, 2015)
[121] The newly proposed London Plan expects an on-site reduction of at least 35% beyond Building Regulations
[122] Larger than 1000m2 or 10 dwellings
[123] Greater London Authority, “London Plan Overview and Introduction.”
[124] Greater London Authority, “Energy Planning Guideline.”
[125] Day et al., “The Use of the Planning System to Encourage Low Carbon Energy Technologies in Buildings.”
[126] Ministry of Housing Communities and Local Government, “Neighbourhood Planning.”
[127] Cave et al., “Comparison of the Planning Systems in the Four UK Countries.”
[128] The Scottish Government, “Community Planning.”
[129] Planning Aid Wales, “Place Plans.”
[130] Clifford et al., “Assessing the Impacts of Extending Permitted Development Rights to Office-to-Residential Change of Use in England”; Clifford et al., “Research into the Quality Standard of Homes Delivered through Change of Use Permitted Development Rights,” 2020.
[131] COMEAP, “Associations of Long-Term Average Concentrations of Nitrogen Dioxide with Mortality - A Report by the Committee on the Medical Effects of Air Pollutants.”
[132] Environmental Protection UK and The Institute of Air Quality Management, “Land-Use Planning & Development Control: Planning For Air Quality.”
[133] Gemmell, “Cleaner Air for Scotland Strategy: Independent Review.”
[134] Environmental Protection UK and The Institute of Air Quality Management, “Land-Use Planning & Development Control: Planning For Air Quality.”
[135] Arbon and Kilbane-dawe, “Manual B - Minimising Air Pollution from New Developments.”
[136] (Greater London Authority, n.d.)
[137] West Yorkshire Local Authorities, “West Yorkshire Low Emissions Strategy 2016 to 2021.”
[138] We note that although this has been published by the UK’s Ministry of Housing, Communities and Local Government, the proposed reforms are only applicable in most part to England.
[139] Hastings et al., “The Cost of the Cuts: The Impact on Local Government and Poorer Comunities.”
[140] National Audit Office, “The Impact of Funding Reductions on Local Authorities.”
[141] UK Government Digital Service, “Digital Efficiency Report.”
[142] Hughes, “NHS Digitisation Expected to Cost up to £13bn – Report.”
[143] Heads of Planning Scotland, “Action Report from Heads of Planning Scotland on the Recent CIPFA/HOPE Survey on Costing the Planning Service in Scotland.”
[144] Scottish Government, “Local Housing Strategy: Guidance 2019”; Barker, “Northern Ireland Misses Annual Social Housing Build Target by More than Half as Pandemic Bites”; Barker, “Welsh Government Pumps Extra £24m into Affordable Housing as Building Target Deadline Looms”; National Housing Federation, “Capital Grant Required to Meet Social Housing Need in England 2021 – 2031.”
[145] Department for Transport, “Walking and Cycling Statistics”; Department for Transport, “Mode of Travel.”
[146] Department for Transport, “Walking and Cycling Statistics.”
[147] Sustrans, “Covid-19 Temporary Cycling and Walking Interventions”; Reid, “U.K. Government Boosts Bicycling And Walking With Ambitious £2 Billion Post-Pandemic Plan.”
[148] Vivid Economics and Barton Willmore, “Levelling Up and Building Back Better Through Urban Green Infrastructure: An Investment Options Appraisal.”
[149] Natural England, “An Estimate of the Economic and Health Value and Cost Effectiveness of the Expanded WHI Scheme 2009. TIN055.”
[150] Barker, Churchill, and Crawford, “Leeds Parks Survey: Findings in Numbers.”
[151] Vivid Economics and Barton Willmore, “Levelling Up and Building Back Better Through Urban Green Infrastructure: An Investment Options Appraisal.”
[152] Greater London Authority, “Energy Planning Guideline.”
[153] The Royal Town Planning Institute, “Resourcing Public Planning.”
[154] Using the English definition of major development as developments larger than 1000m2 or 10 dwellings.
[155] This represents 13.4 million in England, 3.5 million in Scotland, 1.5 million in Northern Ireland and 0.5 million in Wales.
[156] Ministry of Housing Communities and Local Government, “Planning For The Future: White Paper August 2020.”
[157] Auditor General for Wales, “The Effectiveness of Local Planning Authorities in Wales.”
[158] Ministry of Housing Communities and Local Government, “Planning For The Future: White Paper August 2020.”
[159] The Royal Town Planning Institute, “Plan The World We Need: The Contribution of Planning to a Sustainable, Resilient and Inclusive Recovery.”
[160] We assume that the stock of affordable housing persists and that people continue to get annual benefits from living in the units
[161] We assume that people who were homeless and enter affordable housing continue to be at risk of homelessness, and that they continue to live in social housing. We also assume that previously homeless individuals only move into social housing and not affordable home ownership.
[162] Affordable rent includes both affordable rent and London affordable rent. Affordable housing ownership includes shared ownership and affordable home ownership.
[163] In absence of data, the 2019 social lets to homeless households is calculated as an average of the previous 5 years.
[164] For England and Wales, the percentage allocation of affordable housing under planning to previously homeless households is the same as that of all social lettings.
[165] Percentage allocation of affordable housing to homeless under planning is the same as the percentage of total lettings to homeless of local authority dwellings
[166] In absence of data, we assume that the percentage of lettings to homeless in 2000-01 is the same as in 2001-02
[167] We assume the percentage types of affordable housing under local authority and other providers is the same as that of registered social landlords.
[168] Affordable ownership includes shared ownership and shared equity
[169] We assume that people who moved into affordable housing but were not previously homeless were living in conditions comparable to the private sector
[170] We assume the probability that new affordable unit leads to decreased overcrowding is the same in Scotland and Wales as in England
[171] We assume that people who were previously living in overcrowded homes and move into affordable housing continue to be at risk of overcrowding, and continue to live in affordable housing
[172] We assume the proportion of private sector homes that are a risk to safety is the same in Scotland and Wales as in England
[173] The implicit assumption is that the average household size in affordable housing is the same as the average household size in the UK, except for homeless households which we conservatively estimate to be one individual
[174] We assume the NHS savings of issues of poor quality housing are comparable in Scotland and Wales to England
[175] We assume the annual costs to Scotland and Wales healthcare systems of homelessness is comparable to that in England
[176] We assume affordable housing savings per square foot are the same in Scotland and Wales as in England
[177] We assume the population group eligible for modal shift benefits is 15-64


